 Contact
GDIV: A Potential Shelter from the Storm
October 11, 2023


As we round into the back end of 2023, U.S. equity investors are left weighing current valuations with the potential for more persistent inflationary forces, a longer-than-expected Fed pause, a higher for longer interest rate backdrop, and U.S. recession risk. Looking ahead, we believe dividend growth equities are well positioned given their generally higher quality profiles, prudent management teams, and performance history in later phases of the market cycle.
The Harbor Dividend Growth Leaders ETF (GDIV) employs a Growth-at-a-Reasonable Price (GARP) approach seeking companies with underappreciated earnings growth trading at reasonable valuations. GDIV actively invests in companies that it believes possess high-quality balance sheets, consistent free cash flow generation, histories of dividend appreciation, and management teams that are strong stewards of capital. Moving forward, we find that GDIV’s emphasis on dividend growth opportunities with equity upside participation during market advances and downside hedge capabilities during market declines appears well positioned for the uncertain road ahead.
Average Annual Returns as of 09/30/2023
| 3 Months | YTD | 1 Yr. | 3 Yr. | 5 Yr. | 10 Yr. | Since Inception (04/30/2010) | Gross Expense Ratio | |
|---|---|---|---|---|---|---|---|---|
| Harbor Dividend Growth Leaders ETF (NAV) | -3.19% | 3.49% | 15.09% | 8.55% | 8.80% | 10.17% | 10.88% | 0.50% |
| Harbor Dividend Growth Leaders ETF (Market) | -3.27% | 3.57% | 14.99% | 8.55% | 8.80% | 10.17% | 10.88% | 0.50% |
| S&P 500 Index | -3.27% | 13.07% | 21.62% | 10.15% | 9.92% | 11.91% | 12.22% | - |
| NASDAQ U.S. Dividend Achievers Select® Index | -4.10% | 3.39% | 17.31% | 8.42% | 9.05% | 10.58% | 11.16%% | - |
| SEC 30-Day Unsubsidized Yield (as of 09/30/2023) | Dividend Yield (as of 09/30/2023) |
|---|---|
| 1.78% | 2.35% |
Source: Morningstar Direct, FactSet.
Performance data shown represents past performance and is no guarantee of future results. Past performance is net of management fees and expenses and reflects reinvested dividends and distributions. Past performance reflects the beneficial effect of any expense waivers or reimbursements, without which returns would have been lower. Investment returns and principal value will fluctuate and when redeemed may be worth more or less than their original cost. Returns for periods less than one year are not annualized. Current performance may be higher or lower and is available through the most recent month end at harborcapital.com or by calling 800-422-1050. For the most current quarter end performance click here.
ETF performance prior to 5/23/22 is attributable to the Westfield Capital Dividend Growth Mutual Fund, Institutional Share class and/or Westfields private investment vehicle. The historical NAV of the predecessor are used for both NAV and Market Offer Price performance from inception to ETF listing date. Performance periods since GDIV listing date may contain NAV and MOP data of both the newly formed ETF and the predecessor fund performance. Please refer to the Fund prospectus for further details.
Current 30-Day Yields are for the Institutional Class and represent the average annualized income dividend over the last 30 days excluding gains and losses as defined by the SEC. Current 30-Day Yield-Unsub is the Current 30-Day Unsubsidized SEC Yield and does not reflect reimbursements or waivers of fees currently in effect.
The FactSet Dividend Yield is calculated on a quarterly basis by taking the annual dividends per share, for each of the underlying securities held as of the report date, and dividing by the ending price.
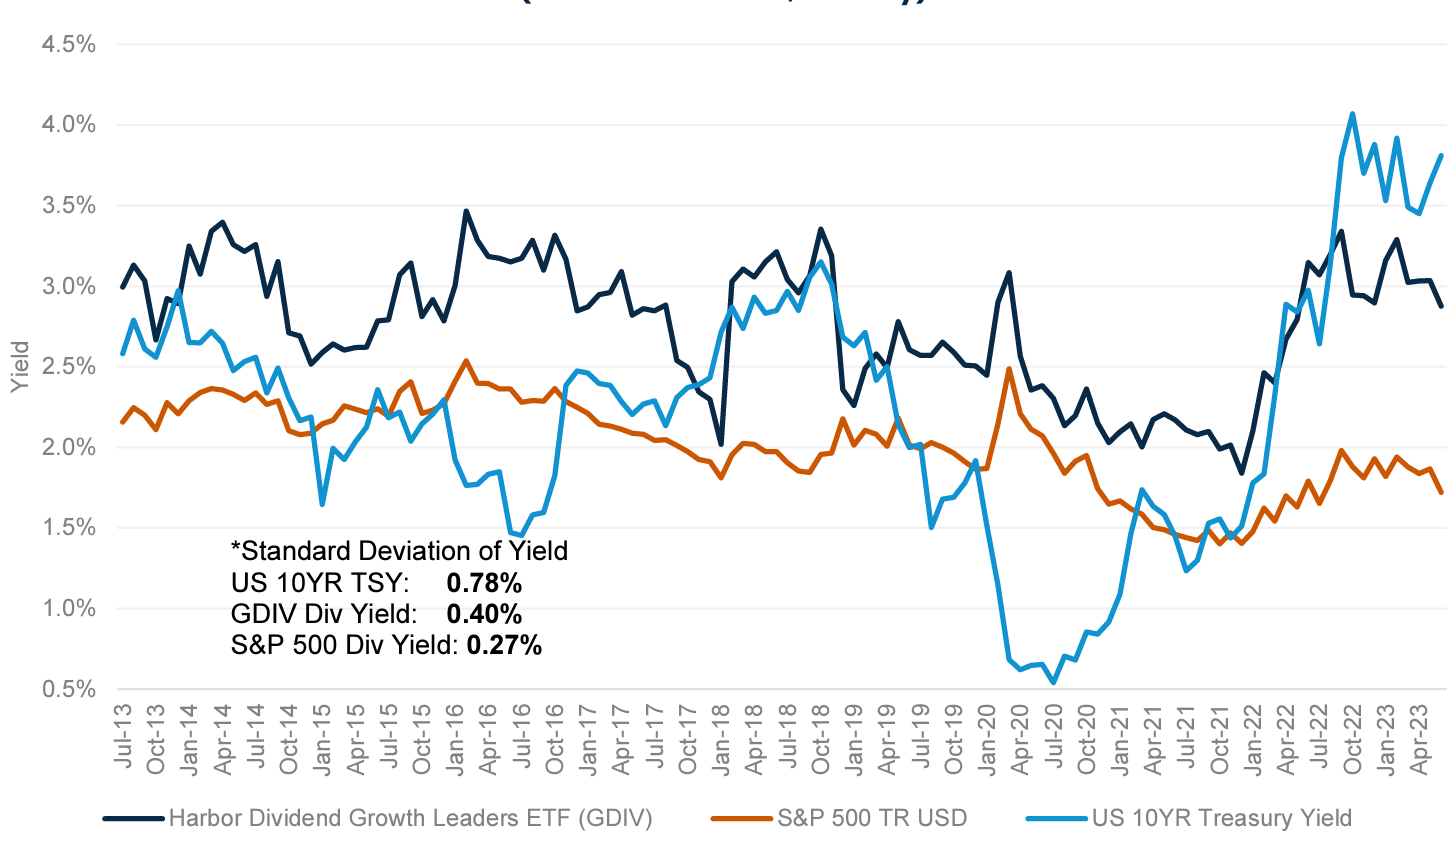
Harbor Dividend Growth Leaders & S&P 500 Index - Equity Style Factor Dividend Yield
vs.
US 10YR Treasury Yield
(Jul 2013 - Jun 2023, Monthly)
Source: Morningstar Direct, FactSet.
Performance data shown represents past performance and is no guarantee of future results.
The Harbor Dividend Growth Leaders ETF also seeks to provide the advantage of greater income stability. As exhibited above, in the most recent decade GDIV produced a consistently stronger dividend yield in comparison to the S&P 500 Index. Moreover, income from equities displayed more stability than fixed income over the past 10 years as demonstrated by the higher standard deviation of yield for the 10YR Treasury vs. GDIV or the S&P 500*. Thus, GDIV has displayed the propensity to produce a stronger and steadier source of income than the aforementioned alternatives.
Active Advantages
We find it important to note that an investment in a dividend growth strategy can also help investors maintain purchasing power amidst periods marked by elevated pricing pressures.
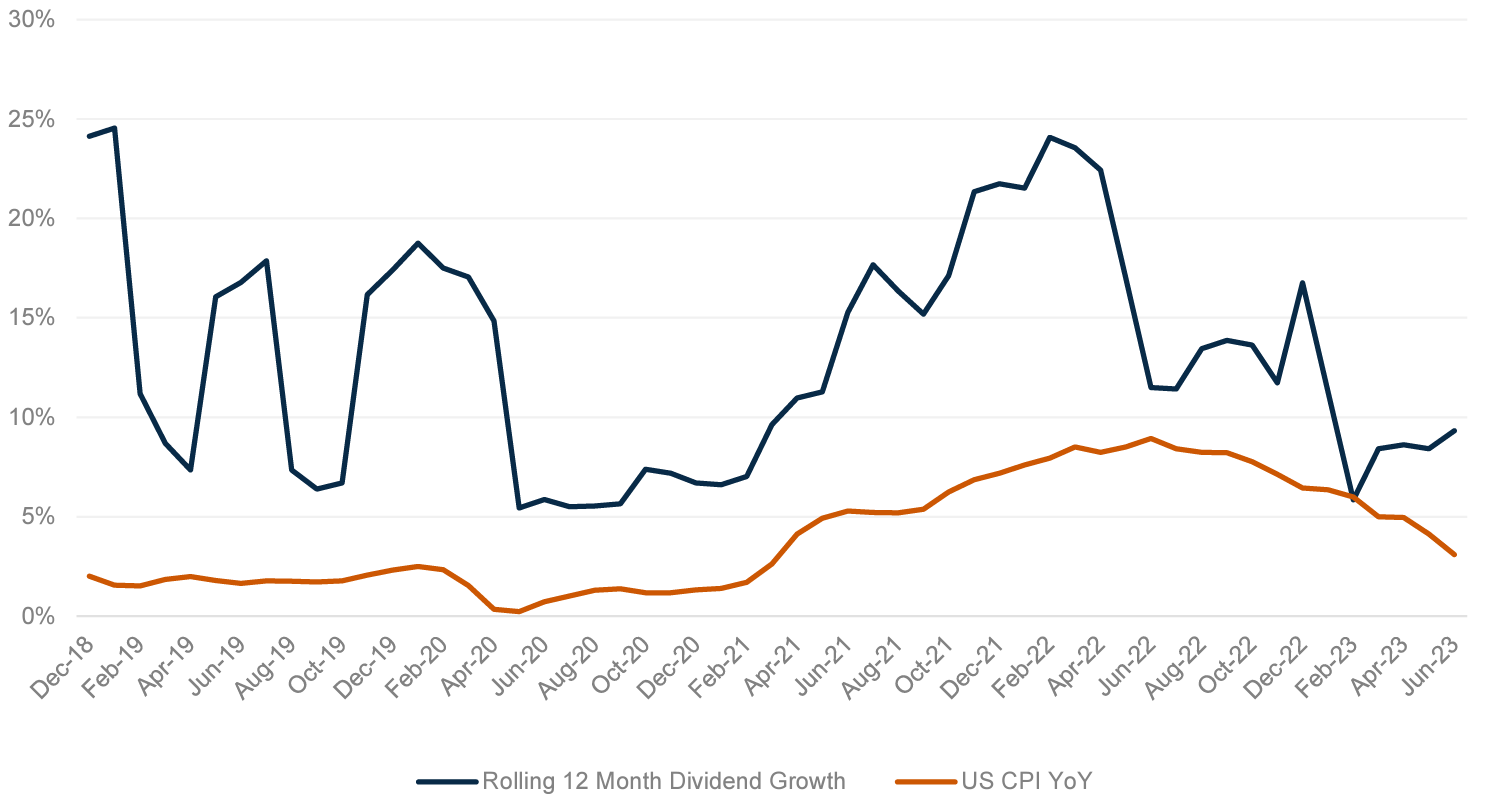
Harbor Dividend Growth Leaders ETF (GDIV) Rolling 12 Month Dividend Growth
vs.
US CPI YoY
Jan 2019 - Jun 2023 (Monthly)
YoY is an abbreviation for year-over-year.
Source: FactSet Research Systems.
Performance data shown represents past performance and is no guarantee of future results.
As you will see in the chart above, GDIV’s weighted average rate of dividend growth largely outpaced the rate of inflation (U.S. Consumer Price Index) over the past four years. In fact, GDIV’s rolling 12 month dividend growth rate outpaced U.S. CPI (year over year) across a range of macro conditions, including during both high and low inflationary environments. Importantly, companies that can increase dividend payments faster than the overall rate of inflation can help investors to maintain purchasing power amidst high inflationary environments. With the future direction of inflation in question, this remains an important consideration, in our view, as we move ahead.
We believe GDIV’s active approach also offers compelling advantages, given its ability to rebalance on forward-looking indicators. For example, a company may plan to spend larger portions of its profits in the next year on dividends but is simultaneously carrying elevated levels of debt relative to income. In this way, GDIV is able to deftly identify and make adjustments based on the team’s identification of investment candidates that may be positioned to cut dividends. Just as important as upside capture can be, mitigating risks and downside pressures can prove equally beneficial, in our view.
Important Information
This material is authorized for use only when preceded or accompanied by the current Harbor Capital funds prospectus or summary prospectus, if available. Click here to view the Fund's Prospectus.
ETF performance prior to 5/23/22 is attributable to the Westfield Capital Dividend Growth Mutual Fund, Institutional Share class and/or Westfields private investment vehicle. The historical NAV of the predecessor are used for both NAV and Market Offer Price performance from inception to ETF listing date. Performance periods since GDIV listing date may contain NAV and MOP data of both the newly formed ETF and the predecessor fund performance. Please refer to the Fund prospectus for further details.
Investments involve risk including the possible loss of principal. There is no guarantee the investment objective of the Fund will be achieved. The Fund's emphasis on dividend paying stocks involves the risk that such stocks may fall out of favor with investors and under-perform the market. There is no guarantee that a company will pay or continually increase its dividend. The Fund may invest in a limited number of companies or at times may be more heavily invested in particular sectors. As a result, the Fund's performance may be more volatile, and the value of its shares may be especially sensitive to factors that specifically effect those sectors. The Fund may invest in foreign securities which may be more volatile and less liquid due to currency fluctuation, political instability, government sanctions, social and economic risks. Foreign currencies can decline in value and can adversely affect the dollar value of the fund.
Investing involves risk, principal loss is possible. Unlike mutual funds, ETFs may trade at a premium or discount to their net asset value. Shares are bought and sold at market price not net asset value (NAV). Market price returns are based upon the closing composite market price and do not represent the returns you would receive if you traded shares at other times.
Free cash flow represents the cash that a company generates after accounting for cash outflows to support operations and maintain its capital assets.
Standard deviation is a statistical measurement in finance that, when applied to the annual rate of return of an investment, sheds light on that investment's historical volatility.
Upside capture is a measure of a strategy’s performance in up markets relative to an index.
Weighted average rate is an average that is adjusted to reflect the contribution of each value to the total amount.
Yield is a measure of cash flow that an investor gets on the amount invested in a security.
The views expressed herein are those of Harbor Capital Advisors, Inc. investment professionals. They may not be reflective of current opinions, are subject to change without prior notice, and should not be considered investment advice.
The S&P 500 Index is an unmanaged index generally representative of the U.S. market for large capitalization equities. The NASDAQ U.S. Dividend Achievers Select® Index is a modified market capitalization weighted index. The NASDAQ U.S. Dividend Achievers Select® Index is comprised of a select group of securities with at least ten consecutive years of increasing annual regular dividend payments. Indices listed are unmanaged and do not reflect fees and expenses and are not available for direct investment.
Westfield Capital Management, L.P. is the subadvisor for the Harbor Dividend Growth Leaders ETF
Foreside Fund Services, LLC is the Distributor of the Harbor ETFs.
This material is authorized for use only when preceded or accompanied by the current Harbor Capital funds prospectus or summary prospectus, if available.
3162570


