


Traditional diversification may not always work the way investors expect → adding a different return driver may help broaden diversification → HGER offers a way to access that exposure.
Diversification: stocks & bonds have been less likely to offset one another
For much of the past two decades, stocks and bonds often moved in opposite directions. When one struggled, the other helped cushion a traditional 60/40 portfolio.1
Since 2020, stocks and bonds have more often risen and fallen together. That means a 60/40 portfolio may provide less diversification than investors have historically expected.
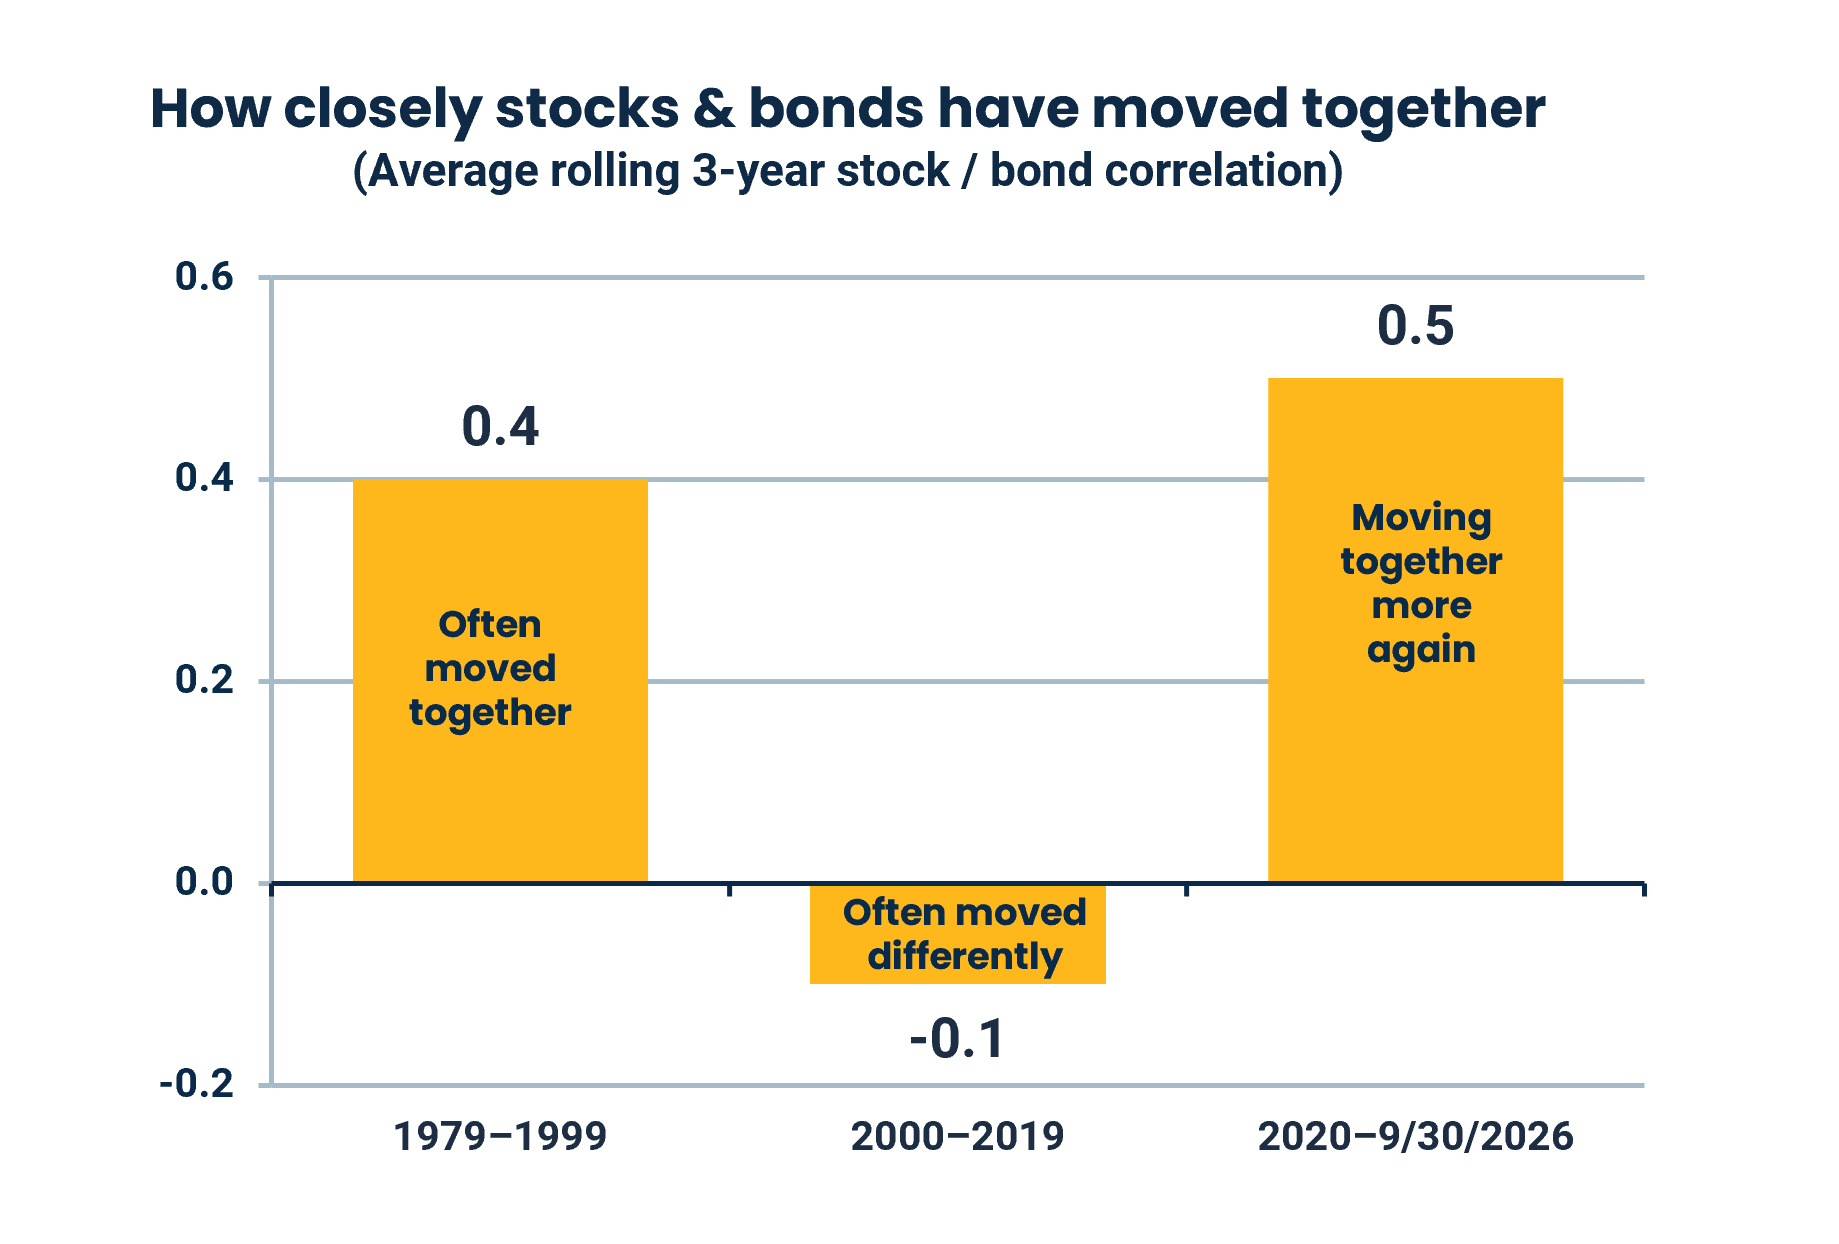
Source: Bloomberg, as of 09/30/2026. Proxies for stocks & bonds represented by S&P 500 Index (stocks) and Bloomberg US Aggregate Bond Index (bonds). Diversification does not assure a profit or protect against loss. Past performance is no guarantee of future results.
Commodities have historically behaved differently from both stocks and bonds, which may help broaden a portfolio’s sources of return when traditional diversification is less effective.
Five structural tailwinds — the “5 Ds”

1. De‑dollarization
A weaker U.S. dollar is spurring demand for alternative stores of value such as gold, which has reached record highs.

2. Diversification
With stock/bond correlations rising, commodities can provide diversification a traditional 60/40 may lack.

3. Deficits
Concerns over larger U.S. budget deficits and debt have supported demand for gold as a perceived safe haven.

4. Deglobalization
Tariffs and the reshoring of supply chains may support prices of commodities such as oil and copper.

5. Datacenters & Electrification
The digital economy appears to be becoming a physical one: AI and data center growth have been driving the largest expansion in power demand in a generation, alongside grid modernization, renewables, and electric vehicles.
How QCI is designed
HGER tracks the Quantix Commodity Index (QCI), built by a team that ran one of the largest commodity index portfolios together at Goldman Sachs. Instead of simple production weights, the index follows a thoughtful, rules‑based build:
START
Starting Weight
24 commodities
Begin with 24 eligible commodities, weighted by their economic significance.
QUALITY SCORE
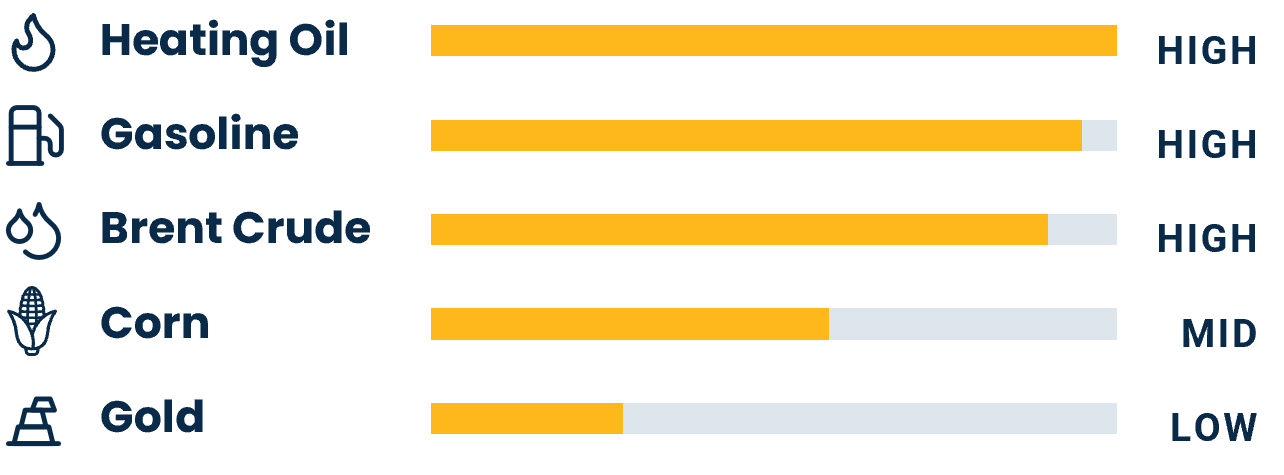
Inflation sensitivity
Tilt toward commodities that are more sensitive to inflation.
QUALITY SCORE
Commodities Futures Pricing
Commodity funds periodically replace expiring contracts. The difference between the selling and buying price can affect returns.
Sell High – Buy Low (aka Backwardation2)
Favor markets where replacing contracts may help returns. Sell the expiring contract at a higher price and buy the next contract at a lower price.
Sell Low – Buy High (aka Contango3)
Avoid markets where replacing contracts may detract from returns. Sell the expiring contract at a lower price and buy the next contract at a higher price.
GOLD OVERLAY
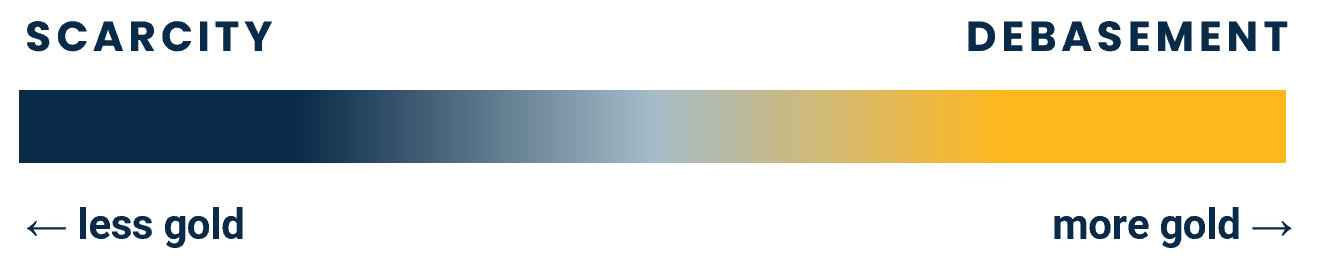
Scarcity–Debasement
Inflation comes from demand (scarcity) and a falling U.S. dollar (debasement). Raise gold's weight when the U.S. dollar may be declining.
RESULT
HGER: a diversified, inflation‑aware commodity ETF
QCI diversification guardrails: minimum 15 commodities • maximum 40% gold / 20% other • minimum 2% per commodity
Why it matters: this dynamic, inflation‑aware design seeks more consistent commodity exposure than traditional production‑weighted indices, which can be dragged down by negative roll yield.
Hypothetical and for illustrative purposes only. Intended solely to demonstrate the construction of the index; actual constituents, weightings, and exposures may vary and are subject to change.
Performance vs. the broad market
Since inception, HGER (NAV) has delivered almost double the Bloomberg Commodity Index's return.
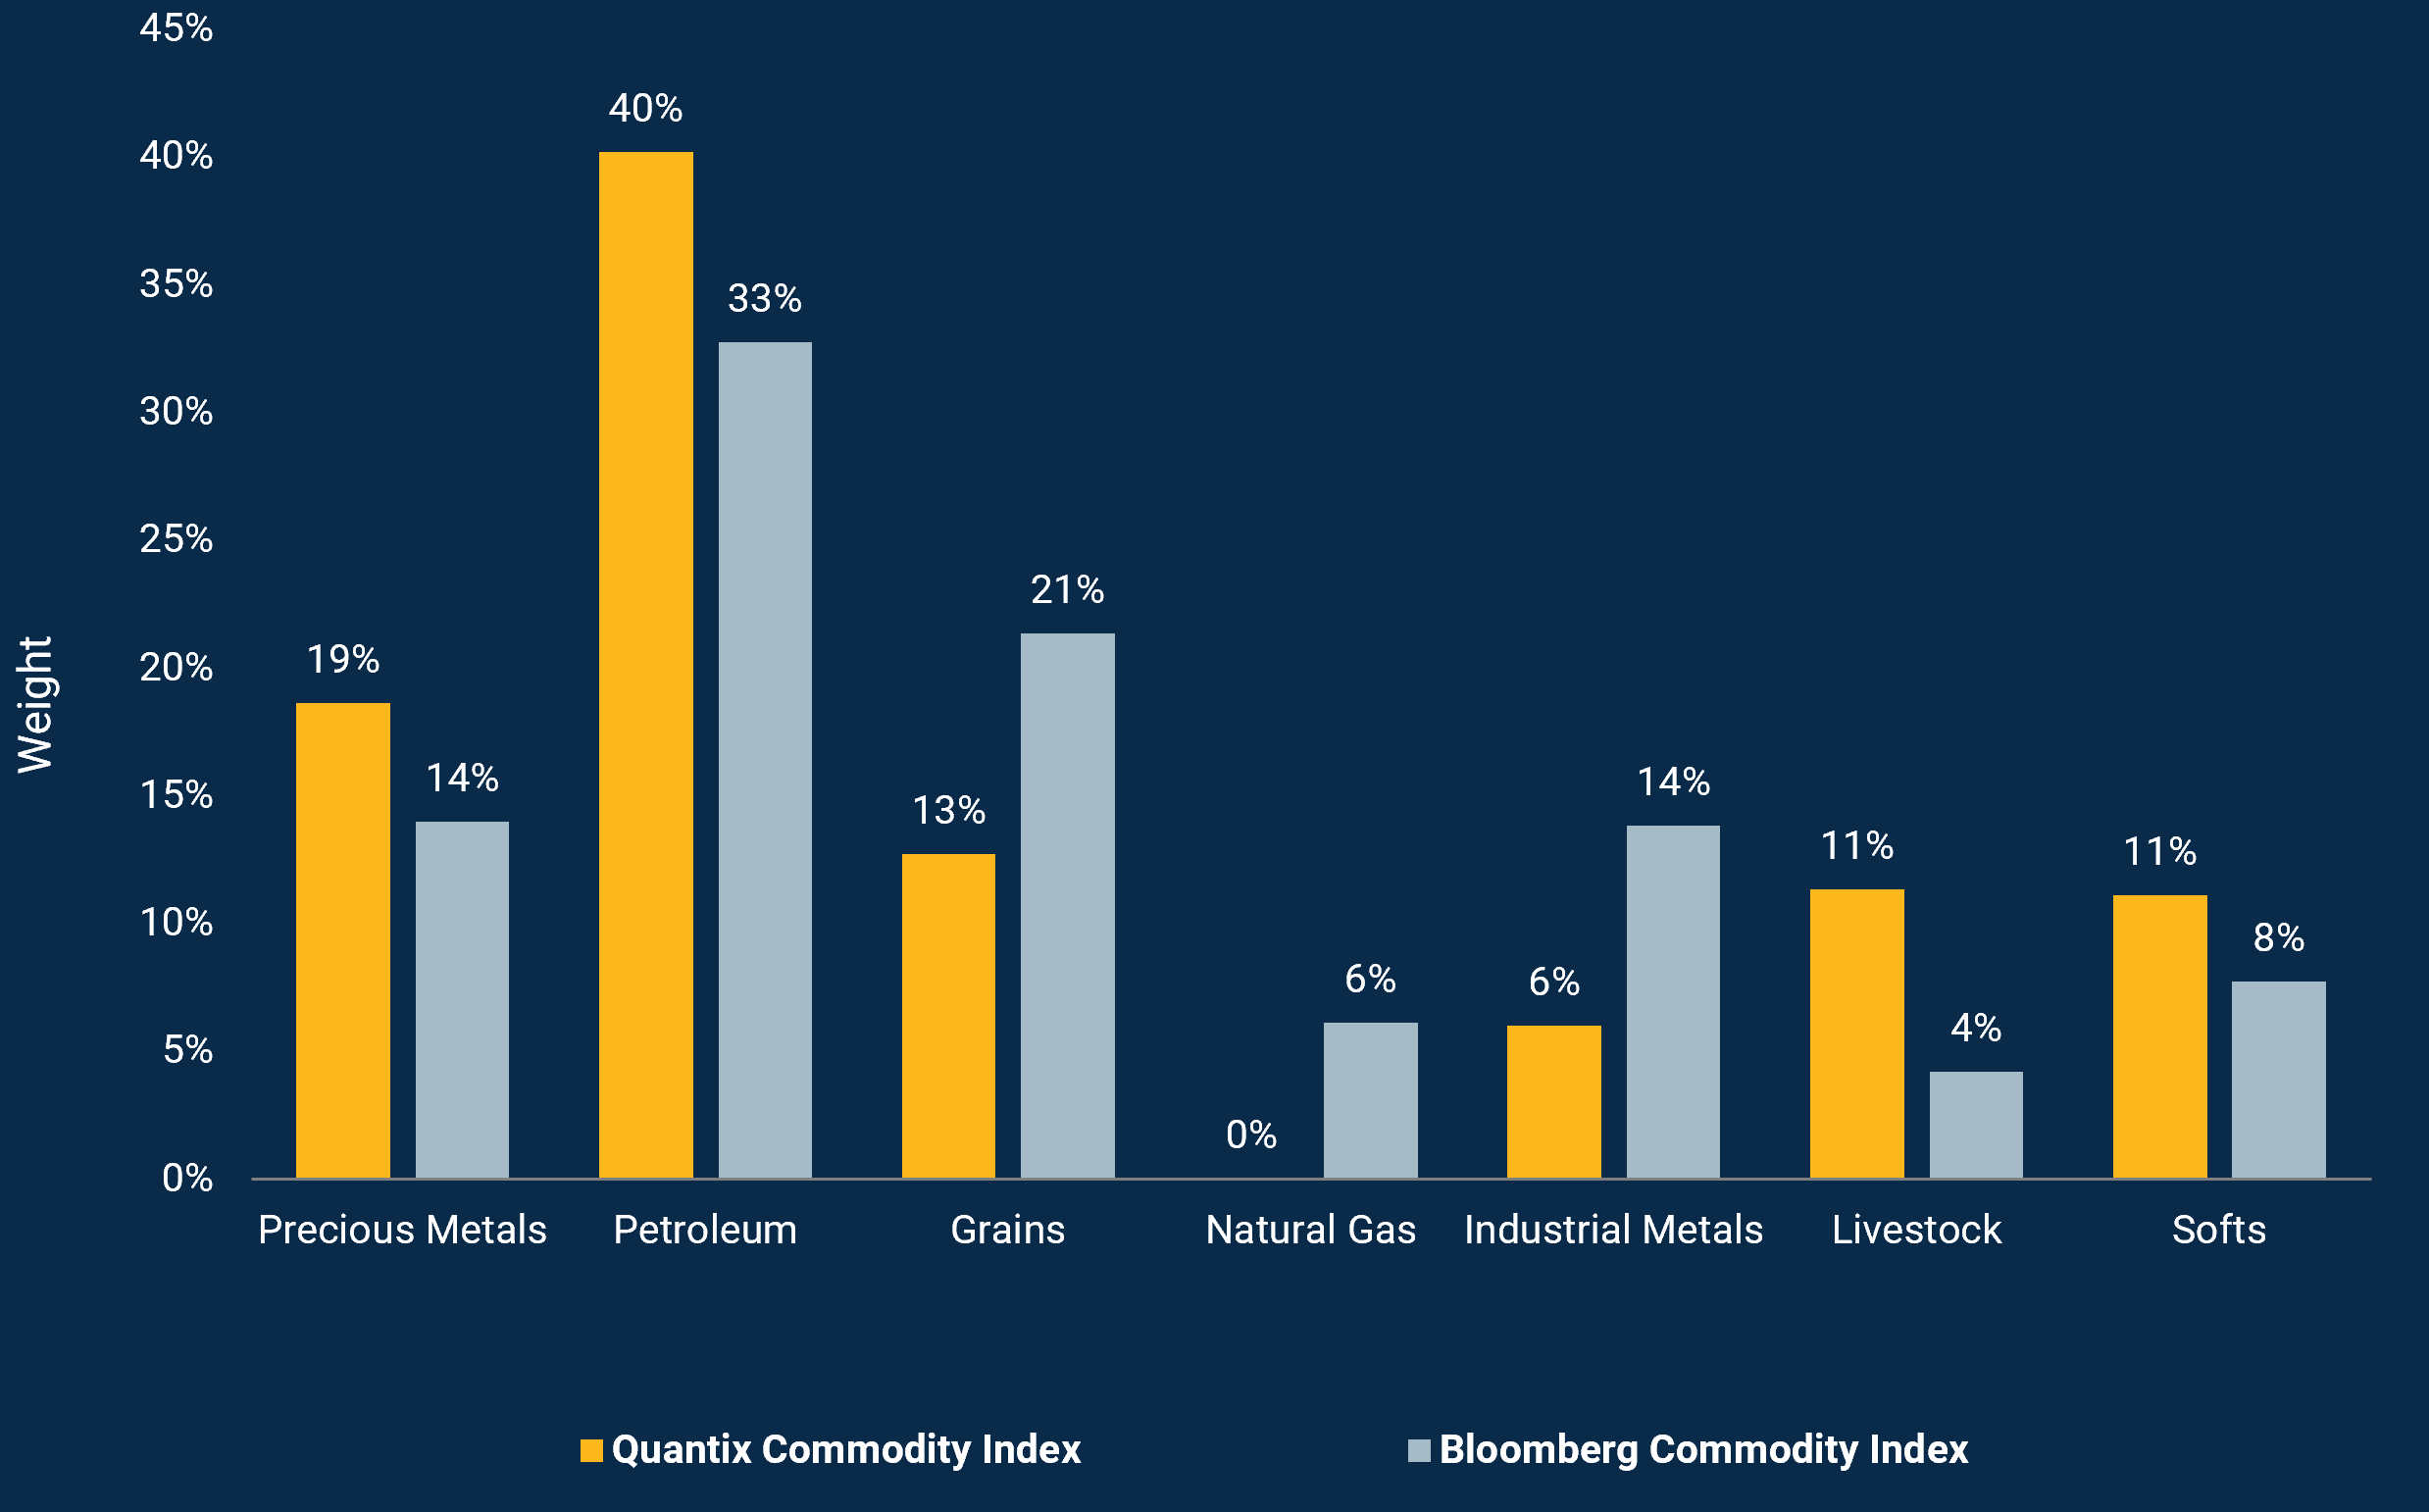
Positioning vs. the broad market — target sector weights (9/30/2026)
Performance data shown represents past performance and is no guarantee of future results. Past performance is net of management fees and expenses and reflects reinvested dividends and distributions. Past performance reflects the beneficial effect of any expense waivers or reimbursements, without which returns would have been lower. Investment returns and principal value will fluctuate and when redeemed may be worth more or less than their original cost. Returns for periods less than one year are not annualized. Current performance may be higher or lower and is available through the most recent month end at harborcapital.com or by calling 800-422-1050.
Source: Morningstar, as of 9/30/2026. The weightings presented reflect those of the indices and may differ from the Fund’s actual portfolio weightings. Fund holdings and allocations are subject to change. The Fund’s returns achieved during certain periods shown were unusual and an investor should not expect such performance to be sustained.
Standout rankings vs. peers
Morningstar Commodities Broad Basket Category Peers
Top quartile over the 1-year, 3-year & since-inception periods. Ranked on total returns as of 9/30/2026; lower percentile is better (1 = best).
The Harbor Commodity All-Weather Strategy ETF (HGER) gives you a simple way to add a diversified mix of commodities to your portfolio to help you adapt to changes in market conditions. It may be a fit if you’re looking to diversify beyond stocks and bonds and add exposure to commodities that can be influenced by inflation, limited supply, and global uncertainty.
Past rankings are no guarantee of future rankings.
Source: Morningstar Direct. The Morningstar Rankings are based on total returns, with distributions reinvested and operating expenses deducted. Morningstar does not take into account sales charges. Harbor Commodity All-Weather Strategy ETF was ranked against Morningstar’s Commodity Broad Basket category, quarterly, over the following time periods for absolute rank as of 9/30/2026: 21st out of 109 investments for the 1-year period, 4th out of 102 investments for the trailing 3-year period, 3rd out of 96 investments for the since inception period. The highest (or most favorable) percentile rank is 1 and the lowest (or least favorable) percentile rank is 100.
Standardized Performance
Average Annual Total Returns — as of 9/30/2026
Performance data shown represents past performance and is no guarantee of future results. Past performance is net of management fees and expenses and reflects reinvested dividends and distributions, and the beneficial effect of any expense waivers or reimbursements, without which returns would have been lower. Investment returns and principal value will fluctuate and, when redeemed, may be worth more or less than their original cost. Returns for periods under one year are not annualized. Current performance may be higher or lower and is available through most recent month end at harborcapital.com or by calling 800-422-1050. The Fund’s returns achieved during certain periods shown were unusual and an investor should not expect such performance to be sustained. Shares are bought and sold at market price not net asset value (NAV). A fund’s NAV is the sum of all its assets less any liabilities, divided by the number of shares outstanding. Market price returns are based upon the closing composite market price and do not represent the returns you would receive if you traded shares at other times. The Fund’s returns achieved during certain periods shown were unusual and an investor should not expect such performance to be sustained.
Eligible Commodities by Sector
24 markets across 7 sectors
Brent Crude Oil
Heating Oil
GasOil
RBOB Gasoline
Wheat
KC Wheat
Soybeans
Soymeal
Soybean Oil
Cotton
Coffee
Sugar
Lean Hogs
Aluminum
Nickel
Zinc
Silver
Important Information
160/40 portfolio: An investment portfolio that generally allocates 60% to stocks and 40% to bonds, seeking to balance growth potential with income and diversification.2Backwardation: A market condition in which near‑term futures contracts are priced higher than longer‑term contracts.
3Contango: A market condition in which near‑term futures contracts are priced lower than longer‑term contracts.
Investing involves risk, including possible loss of principal. Unlike mutual funds, ETFs may trade at a premium or discount to their net asset value. There is no guarantee that the investment objective of the Fund will be achieved. Stock markets are volatile and equity values can decline significantly in response to adverse issuer, political, regulatory, market and economic conditions. A non‑diversified Fund may invest a greater percentage of its assets in securities of a single issuer, and/or invest in a relatively small number of issuers, it is more susceptible to risks associated with a single economic, political or regulatory occurrence than a more diversified portfolio.
Commodity Risk: The Fund has exposure to commodities through its and/or the Subsidiary’s investments in commodity‑linked derivative instruments. Authorized Participant Concentration/Trading Risk: Only authorized participants (“APs”) may engage in creation or redemption transactions directly with the Fund. Commodity‑Linked Derivatives Risk: The Fund’s investments in commodity‑linked derivative instruments (either directly or through the Subsidiary) and the tracking of an Index comprised of commodity futures may subject the Fund to significantly greater volatility than investments in traditional securities. Diversification does not assure a profit or protect against loss in a declining market.
Quantix Commodity Index ("QCI") — is calculated on a total return basis, combining commodity futures returns with the return on cash collateral in 13‑week U.S. Treasury Bills, using Quantix's proprietary methodology (relative inflation sensitivity and the cost of holding a "rolling" futures position). Developed by Quantix Commodities LP; owned by Quantix Commodities Indices LLC. Bloomberg Commodity Index ("BCOM") is designed to be a highly liquid and diversified benchmark for commodity investments via futures contracts. S&P 500 Index represents U.S. large‑cap equities. 60/40 = 60% S&P 500 / 40% Bloomberg US Agg. These indices are unmanaged and do not reflect fees and expenses and are not available for direct investment.
Morningstar Rankings are based on total returns with distributions reinvested and operating expenses deducted (excluding sales charges). HGER was ranked against Morningstar's Commodity Broad Basket category on total returns as of 9/30/2026: 21st out of 109 investments for the 1‑year period, 4th out of 102 investments for the trailing 3‑year period, 3rd out of 96 investments for the since inception period; best rank = 1, worst = 100. ©2026 Morningstar. All rights reserved. The information: (1) is proprietary to Morningstar/its providers; (2) may not be copied or distributed; and (3) is not warranted to be accurate, complete, or timely. Neither is responsible for damages or losses from its use. The views herein may not reflect current opinions and are subject to change; this material is not investment advice or a recommendation or solicitation to buy or sell any security. Harbor Capital provides compensation in connection with obtaining or using third‑party ratings and rankings.
©2026 Harbor Capital Advisors, Inc. All rights reserved. All trademarks are the property of their respective owners.