 Contact
U.S. Large Cap Equities
Opportunities & Considerations for 2024 & Beyond
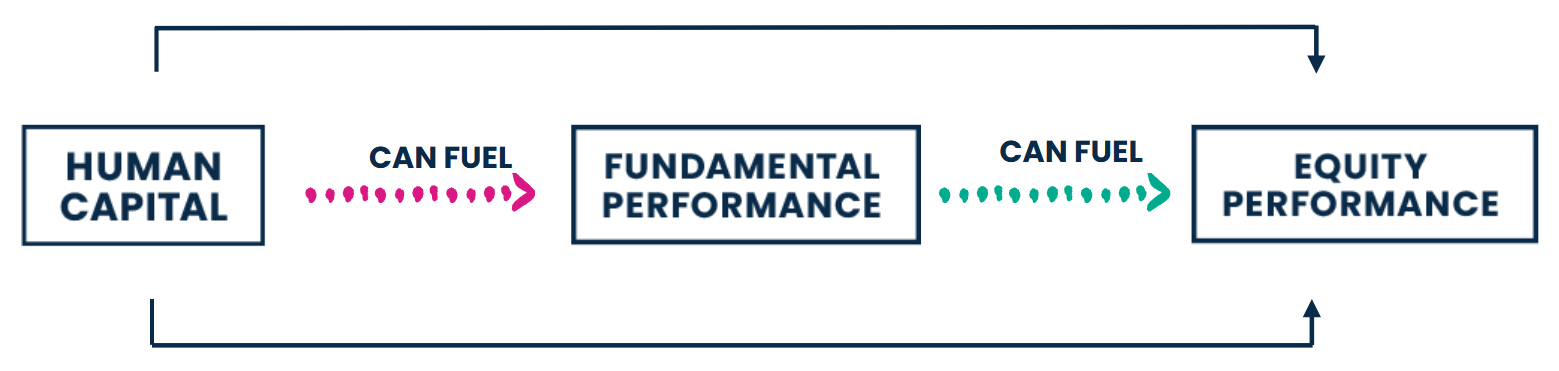
March 04, 2024- Although human capital is an asset, it is accounted for as an expense. This leads to human capital being systematically overlooked, mispriced, and ignored because it is difficult to quantify.
- The Human Capital Factor® (HCF®) seeks to quantify levels of motivation and engagement of a company's workforce in an effort to capture the powerful connection between human capital and stock performance. These HCF® scores assist in addressing a market inefficiency and afford access to a new alpha factor with differentiated excess return potential.
For Illustrative purposes only.
Source: Irrational Capital, October 2023.
- At the core of the HCF® is the distinct data ecosystem developed by Irrational Capital that is proprietary, expansive, and provides wide coverage.
- Private (Exclusive) + Public
- Highly Stable Question Sets
- Survey (Likert scale) + Comments
- Behavioral Only: No Financial Data
- Wide Coverage
- 7,500+ Companies
- 4,200+ Public Companies
- Long, Consistent Data Set
- 17+ Years of Insight
- Deep & Precise Insights
- 750 Million+ data points
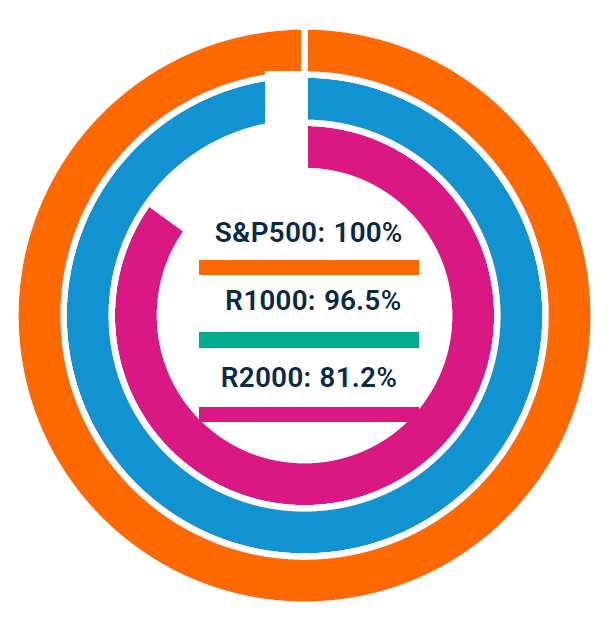
S&P500: S&P 500 Index
R1000: Russell 1000 Index
R2000: Russell 2000 Index
- Through in-depth research, Irrational Capital has identified the seven dimensions that are most important to employees.
- Notably, extrinsic factors such as compensation weigh less heavily than intrinsic factors, those that are more personal to an employee's experience.
| HUMAN CAPITAL FACTOR® TYPE | HUMAN CAPITAL SEVEN DIMENSIONS |
|---|---|
| Intrinsic | Organizational effectiveness
Innovation Direct Management Organizational Alignment Engagement Emotional Connection |
| Extrinsic | Extrinsic Rewards |
Source: Irrational Capital, October 2023.
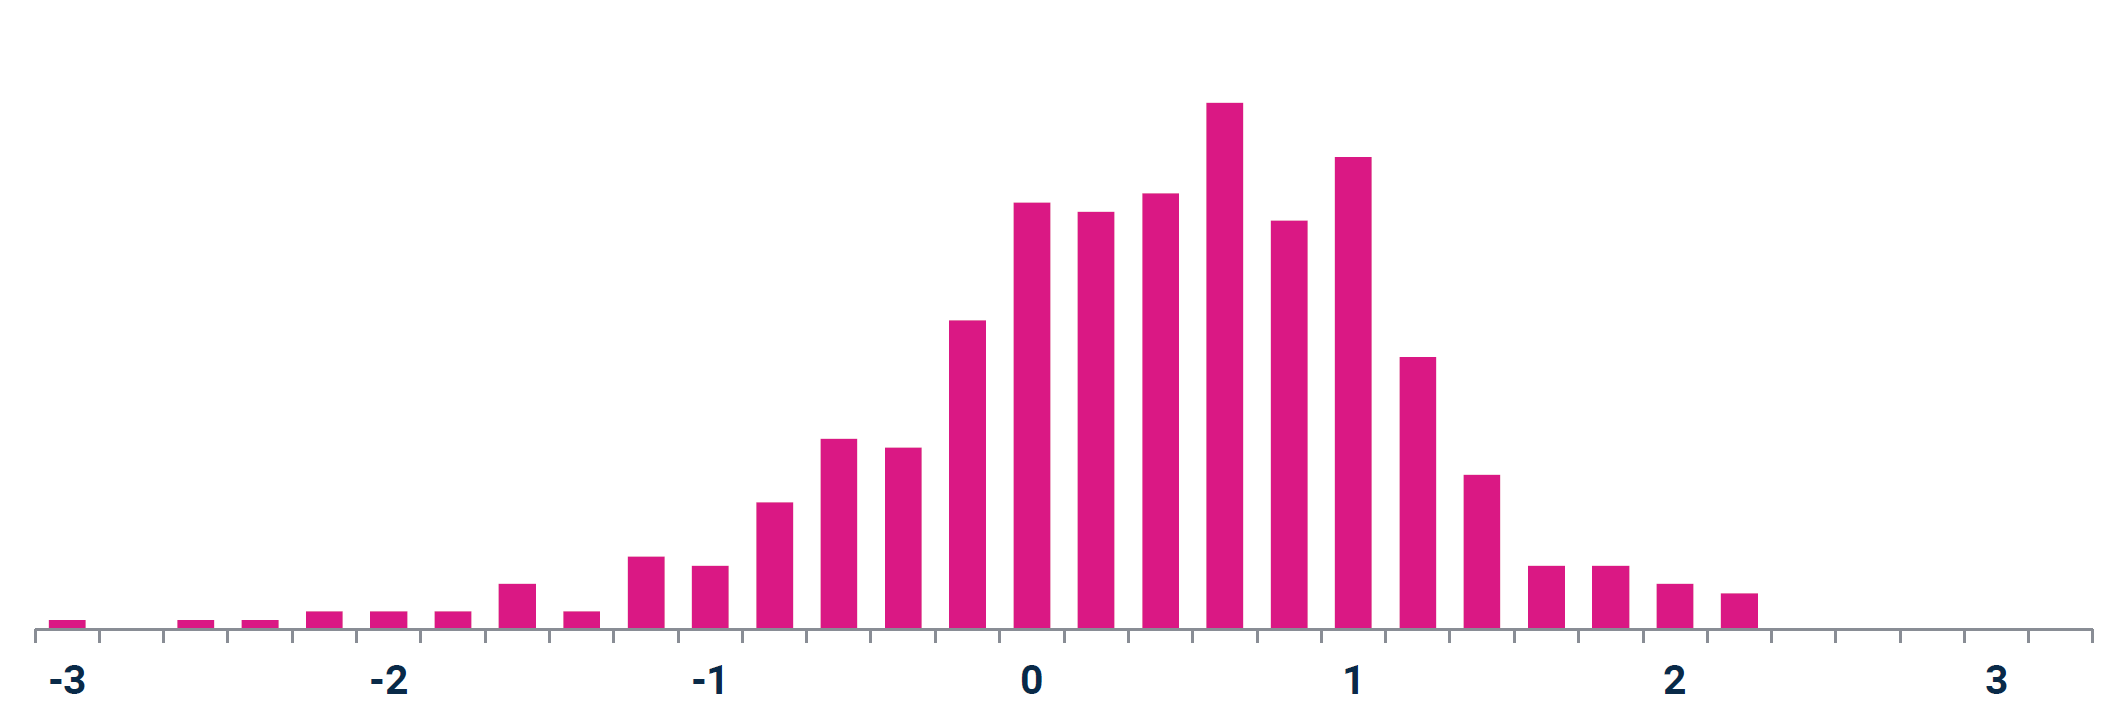
- Each company in the universe is scored on each of the seven dimensions.
- Scores across all seven dimensions are aggregated for each company.
- Raw HCF® values Z-Scored1 across entire universe.
For Illustrative purposes only.
1A Z-score is a statistical measurement that tells you how far away from the mean (or average) your datum lies in a normally distributed sample.
Source: Irrational Capital, October 2023. The Highest (most favorable) raw HCF® value is 3, the lowest (least favorable) raw HCF® value is -3.
Case Study of Improving Human Capital
A Large Hardware and Software Company
- Previously, had a since-described “know it all” culture. Recognizing the need for a culture change, the company replaced the existing CEO with a new CEO in 2014.
- Embraced an open-minded, “learn it all” culture emphasizing innovation, which has produced an exceptional culture. As a result, this company was at the forefront of technology trends such as Cloud and artificial intelligence (AI).
- As the HCF® scores improved at this company, the business has performed well, and its stock went on to outperform the broad market by a wide margin.
1/1/2012 - 12/31/2023
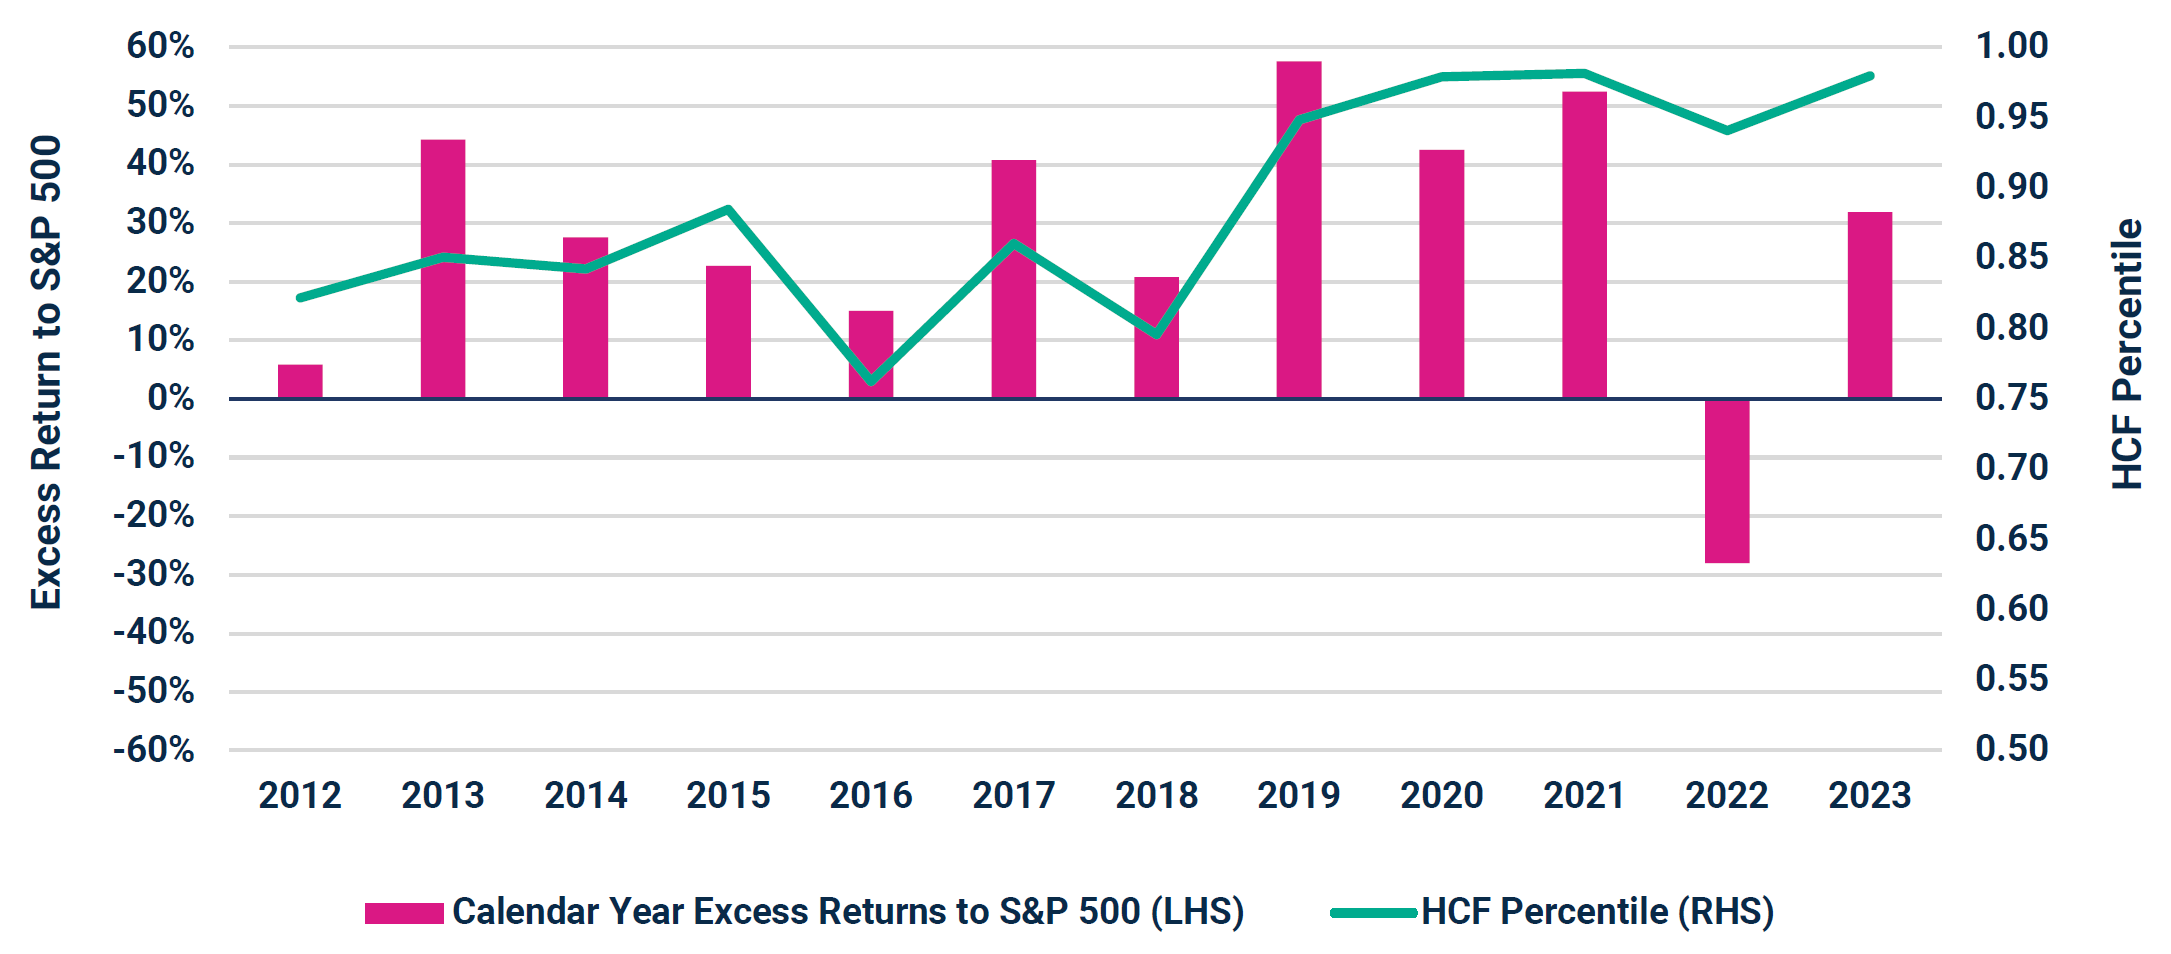
Performance data shown represents past performance and is no guarantee of future results.
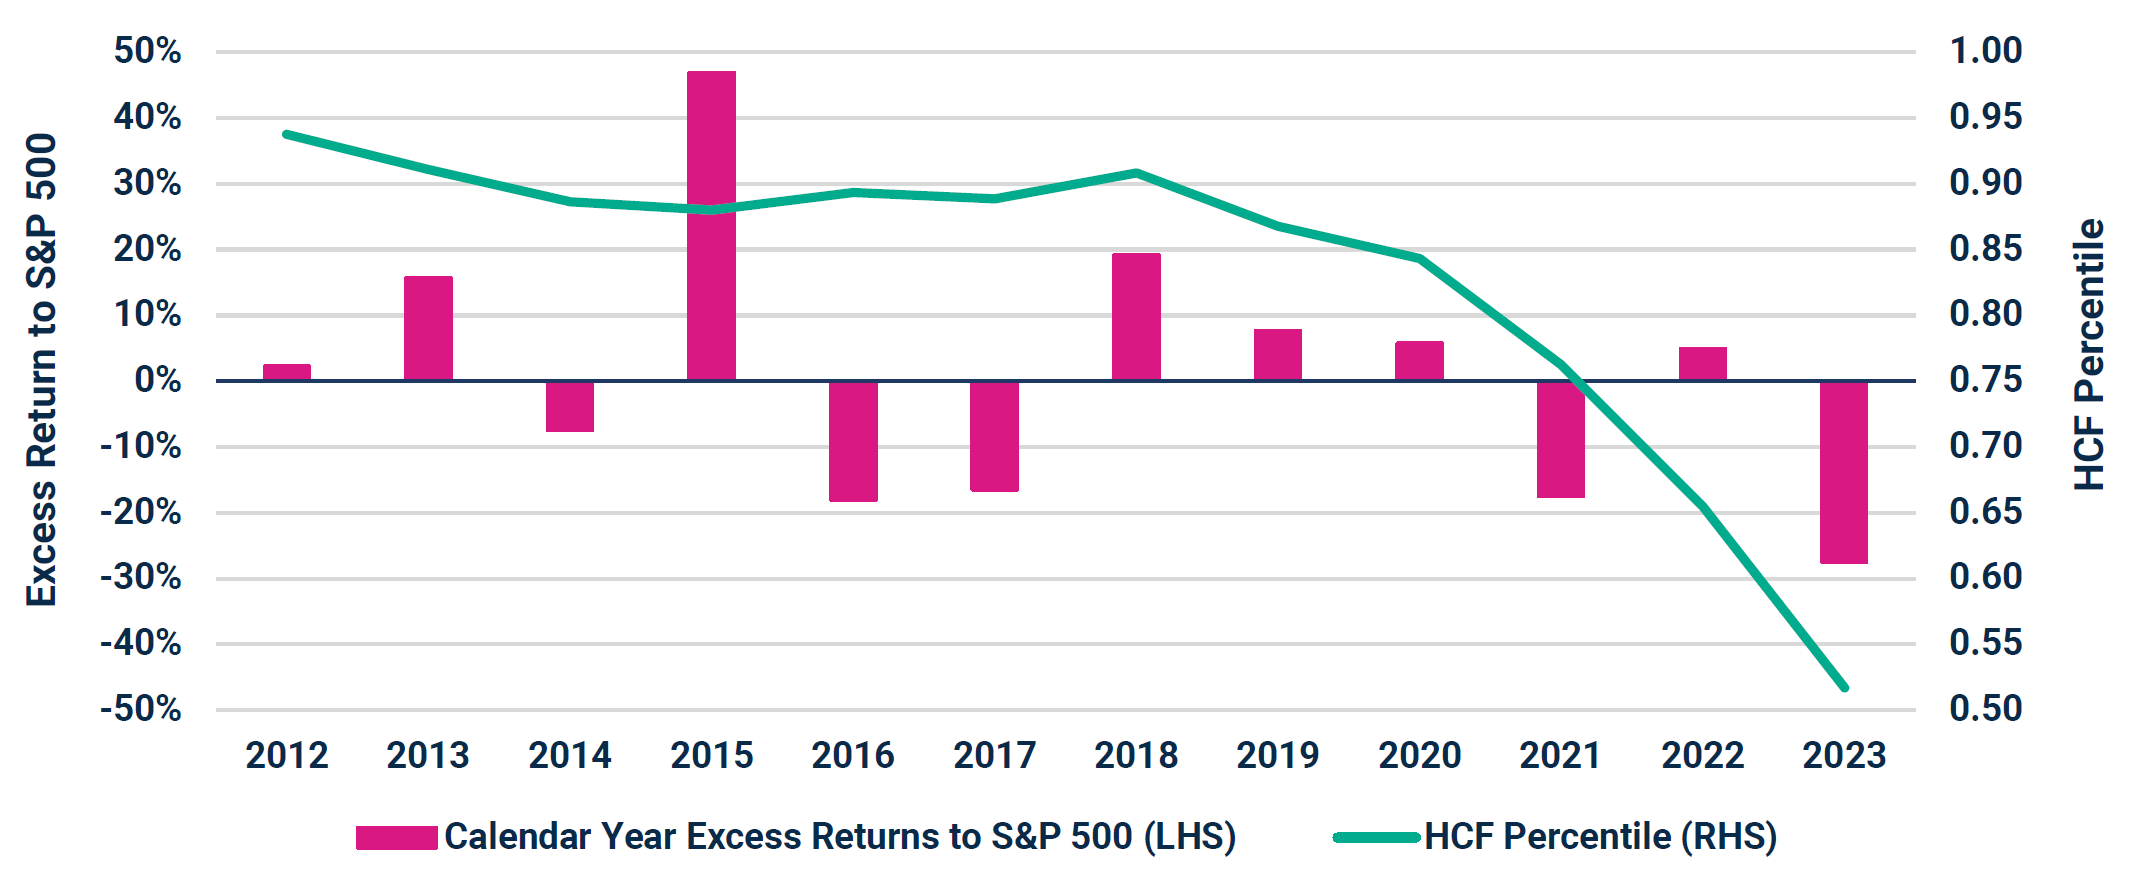
Case Study of Declining Human Capital
A Food and Beverage Retailer
- Founder-centric culture with multiple terms as an on-and-off CEO of the business.
- During the COVID-19 period, a management vs. worker culture emerged. This produced a lack of emotional connection from front-line employees and, ultimately, less organizational alignment and effectiveness.
- As a result, per-store revenue suffered, and the company has underperformed the broad market (S&P 500) in recent years following the declining HCF® score.
1/1/2012 - 12/31/2023
Performance data shown represents past performance and is no guarantee of future results.
Source: Morningstar Direct & Irrational Capital, December 2023. For illustrative purposes only. Security performance is for illustrative purposes only and does not represent actual performance of a security held by Harbor Capital. The Highest (most favorable) is 1, the lowest (least favorable) is 0.
Important Information
The views expressed herein may not be reflective of current opinions, are subject to change without prior notice, and should not be considered investment advice or a recommendation to purchase or sell a particular security.
Past performance is no guarantee of future results.
Investing entails risks and there can be no assurance that any investment will achieve profits or avoid incurring losses. Stock markets are volatile and equity values can decline significantly in response to adverse issuer, political, regulatory, market and economic conditions.
HCF Scoring: Each company in the universe is scored on each of the seven dimensions (organizational effectiveness, innovation, direct management, organizational alignment, engagement, emotional connection, and extrinsic rewards). In the examples provided, eligible constituents are chosen from Solactive GBS United States 500 Index (the “index universe”) at the time of Index reconstitution. The Solactive GBS United States 500 Index intends to track the performance of the largest 500 companies from the US stock market. The index listed is unmanaged and does not reflect fees and expenses and is not available for direct investment. HCF scores across all seven dimensions are aggregated for each company. The raw score reflects aggregate scores across the seven dimensions for every company in the universe. The Z-score then serves to normalize the distribution of raw scores across the universe. A Z-score is a statistical measurement that tells you how far away from the mean (or average) your datum lies in a normally distributed sample. The Highest (most favorable) raw HCF® value is 3, the lowest (least favorable) raw HCF® value is -3.
The S&P 500 Index is an unmanaged index generally representative of the U.S. market for large capitalization equities. The Russell 2000 Index measures the performance of the 2,000 smaller companies included in the Russell 3000 Index. The Russell 1000 Index represents the top 1000 companies by market capitalization in the United States. The Russell 2000® Index, Russell 1000 Index® and Russell® are trademarks of Frank Russell Company. These indices are unmanaged and do not reflect fees and expenses and are not available for direct investment.
Alpha refers to excess returns earned on an investment.
Copyright © 2024 Harbor Capital Advisors, Inc. All rights reserved.
3817955


