 Contact
The Importance of Active in the 2020s
September 2023
September 21, 2023


While the macro backdrop of the 2010s featured low interest rates, low inflation, tight spreads and lower market volatility, the 2020s are proving to be a much different decade. In our view, investors would be well served to lower their return expectations, increase their tolerances, and expand their investor toolkit to navigate what we believe will be a bumpier ride than the past decade. We also think active managers are better positioned to steer investors through these challenging conditions than their passive counterparts.
We point to three distinct themes powering active management in the 2020s:
That Was Then, This Is Now
We find it important to acknowledge that investors are operating in much different conditions in the 2020s than they were in the 2010s. Following a decade in which real returns amounted to almost 8% per year in the 2010s for a traditional 60/40 portfolio, real returns are amounting to less than 2% per year in the 2020s thus far as nominal returns have only reached about 70% of levels seen in the 2010s while simultaneously contending with twice the amount of annualized inflation.
Differences in Economic Conditions:
2010s vs. 2020s
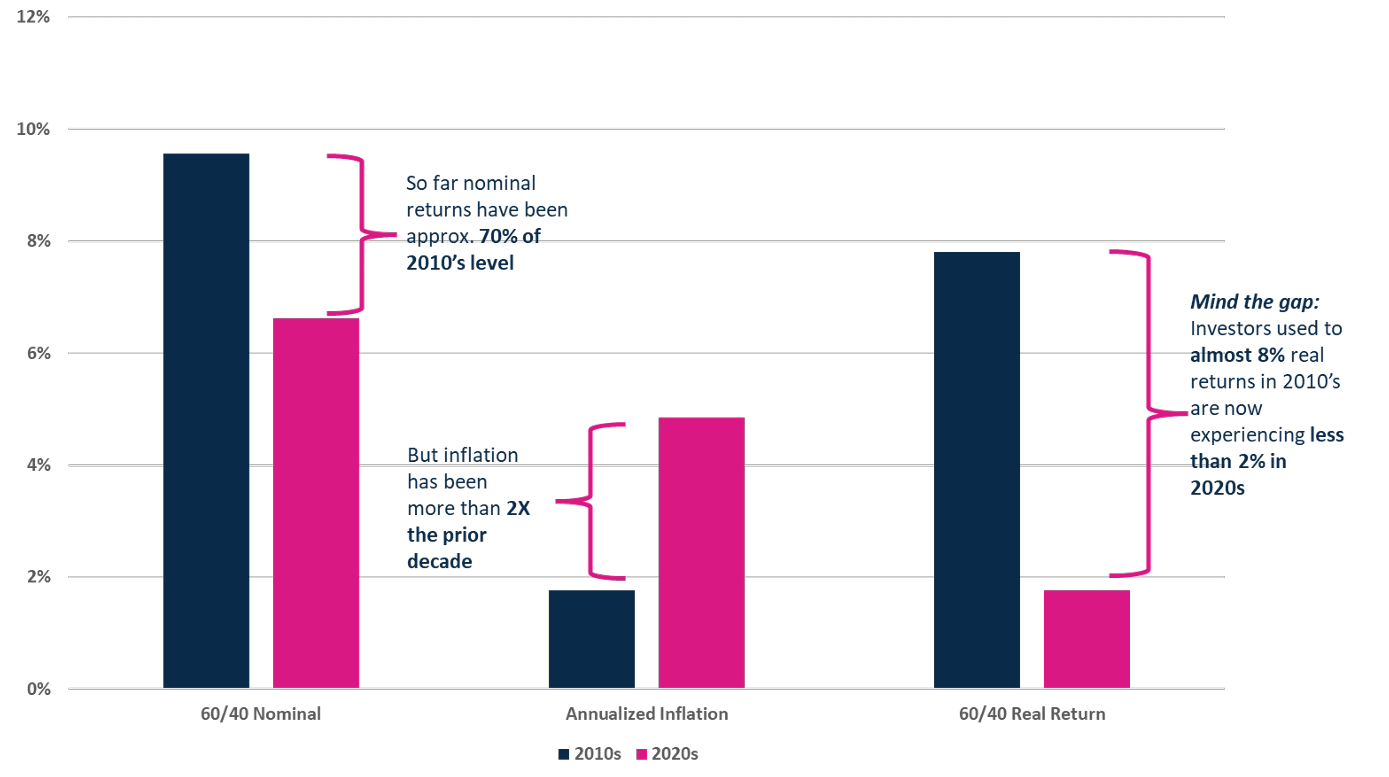
Source: Morningstar Direct & BLS, August 2023. Nominal calculated blending monthly total returns of S&P 500 TR USD (60%) and The Bloomberg US Agg Bond Index (40%) as of 1/1/2010-12/31/2019 and 1/1/2020-6/30/2023. 60/40 Real calculated as Nominal – Time Period Annualized Inflation Rate. Performance data shown represents past performance and is no guarantee of future results.
As such, we think it is vital to recognize that we are living in a world of lower real returns that will require investors to equip themselves with different tools to achieve their investment goals in this decade.
Spotlighting Skilled Active Management
As we have already noted, it is not just elevated inflation cutting into market returns. So far this decade, investors are also battling rising interest rates, heightened market volatility, and a wider gap in returns between the stocks doing well and those doing poorly. Gone is the post-global financial crisis decade defined by a stable, bull market with easy money.
We believe there is a silver lining, though. While today’s rocky investment landscape can be difficult for many to successfully navigate, we believe it actually can benefit active managers. Why is that? Well, if we look back at similar market environments over time, we found that the current one has generally created opportunities, not obstacles, for skilled stock pickers.
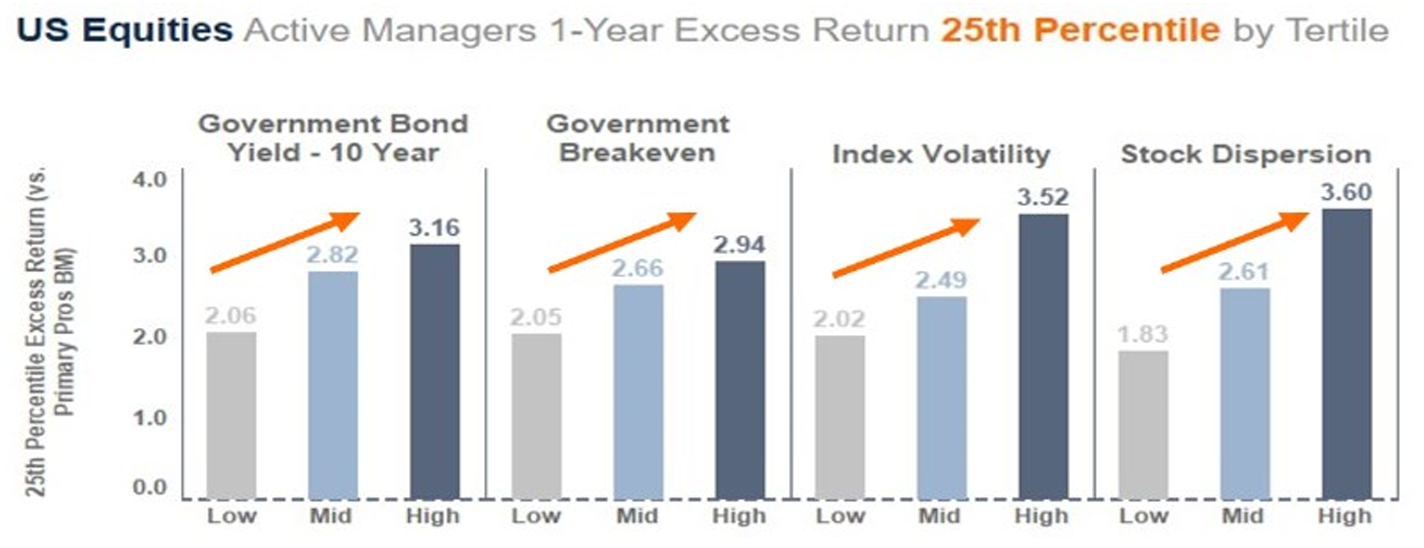
Source: Harbor Capital, Morningstar Direct, FactSet, as of 1/31/2002 - 7/31/2023. Performance data shown represents past performance and is no guarantee of future results. US Equities Active Managers are open-end mutual funds and ETFs in the Large Cap Blend, Growth or Value categories, that are not index funds, as classified by Morningstar. Index volatility is 12-month standard deviation of daily R3000 index return. Primary Pros BM: Benchmark listed as the primary benchmark in each strategy’s prospectus. Index Volatility: Annualized standard deviation of the index daily return.
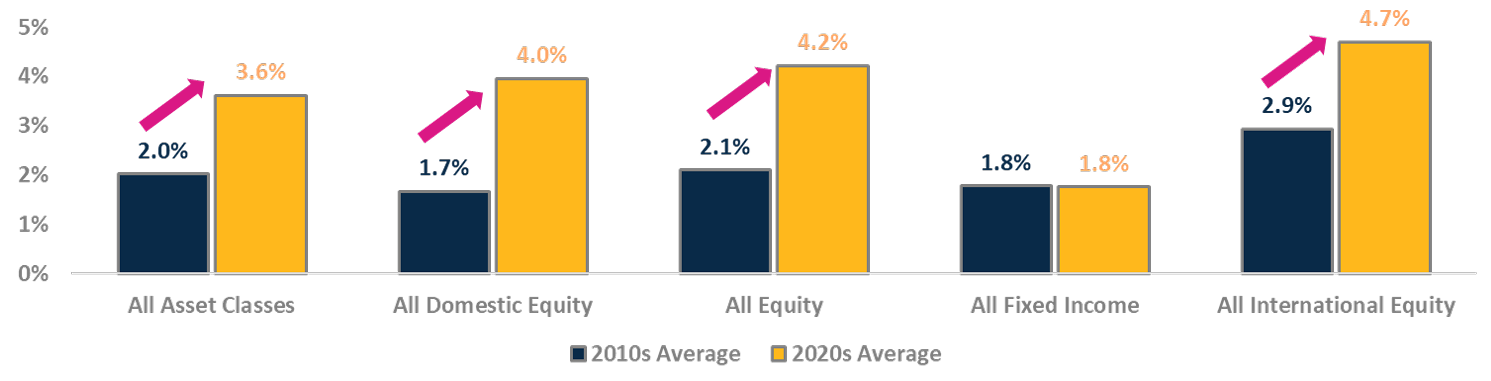
Morningstar Direct, August 2023. Performance data shown represents past performance and is no guarantee of future results. Managers included: All Open-End and ETF managers, oldest share class, excluding passive index strategies. Please see Important Information for additional information.
As we expect these themes to continue into the 2020s, we believe that the choppiness of markets in these macroenvironments make the identification of skilled active managers all the more important as investors seek to narrow in on the winners and avoid the largest losers.
Accessing Active Management
Historically, we recognize that mutual funds have been synonymous with active management and ETFs with passive management. However, we believe that distinction is blurring following an SEC ruling in 2019 that spurred a flurry of new issuance of active ETFS and subsequent growth of optionality for investors. As the investment landscape evolves this decade, we expect to see more active ETFs to enter the market and that they will eventually attract investor dollars as the products season and sport lower fees with more transparency, liquidity, and tax efficiency than their mutual fund peers.
Number & AUM of U.S. ETFs: Active vs Passive
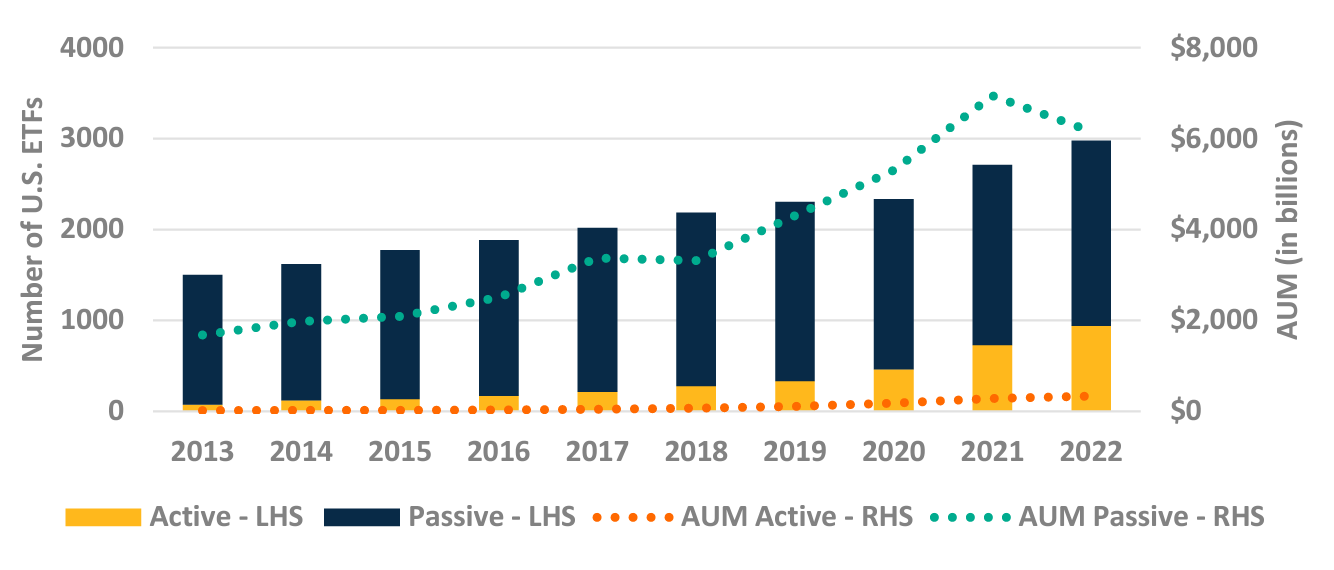
Source: Morningstar Direct; Yearly Total Net Assets by calendar year 01/01/2013-12/31/2022.
Universe: US Open-End Funds & ETFs including obsolete funds & excluding Money Market, FoF’s & Feeder Funds counting by unique FundID. See “Important Information” for definition of “Active”.
While we acknowledge the investment environment will be tougher in the 2020s, we also believe this decade will serve as more of a “return to normal” for macro and market conditions with the anomaly of the 2010s serving as the real outlier. If this is the case, as we believe it is, investing in active mutual funds or ETFs with skilled managers could prove beneficial, and in some cases necessary, for meeting your medium and longer-term financial goals.
Important Information
The views expressed herein may not be reflective of current opinions, are subject to change without prior notice. This material is for informational and illustrative purposes only. This material does not constitute investment advice and should not be viewed as a current or past recommendation or a solicitation of an offer to buy or sell any securities or to adopt any investment strategy.
Past performance is no guarantee of future results.
The information shown relates to the past. Past performance is not a guide to the future.
All investments are subject to market risk, including the possible loss of principal. Stock prices can fall because of weakness in the broad market, a particular industry, or specific holdings. Bonds may decline in response to rising interest rates, a credit rating downgrade or failure of the issue to make timely payments of interest or principal. International investments can be riskier than U.S. investments due to the adverse effects of currency exchange rates, differences in market structure and liquidity, as well as specific country, regional, and economic developments. These risks are generally greater for investments in emerging markets.
Fixed income securities fluctuate in price in response to various factors, including changes in interest rates, changes in market conditions and issuer-specific events, and the value of an investment may go down. This means the potential to lose money.
As interest rates rise, the values of fixed income securities are likely to decrease and reduce the value of a portfolio. Securities with longer durations tend to be more sensitive to changes in interest rates and are usually more volatile than securities with shorter durations. Interest rates in the U.S. are near historic lows, which may increase exposure to risks associated with rising rates. Additionally, rising interest rates may lead to increased redemptions, increased volatility and decreased liquidity in the fixed income markets.
Indices listed are unmanaged, and unless otherwise noted, do not reflect fees and expenses and are not available for direct investment.
Investing entails risks and there can be no assurance that any investment will achieve profits or avoid incurring losses.
ETFs are subject to capital gains tax and taxation of dividend income. However, ETFs are structured in such a manner that taxes are generally minimized for the holder of the ETF. An ETF manager accommodates investment inflows and outflows by creating or redeeming “creation units,” which are baskets of assets. As a result, the investor usually is not exposed to capital gains on any individual security in the underlying portfolio. However, capital gains tax may be incurred by the investor after the ETF is sold.
Morningstar Asset Class Categorization:
All Asset Classes: Large Cap Growth, Large Cap Blend, Large Cap Value, Mid Cap Growth, Mid Cap Blend, Mid Cap Value, Small Cap Growth, Small Cap Blend, Small Cap Value, Custom Disruptive Innovation peer group, Foreign Large Cap Growth, Foreign Large Cap Blend, Foreign Large Cap Value, Foreign Small/Mid Cap Growth, Foreign Small/Mid Cap Blend, Foreign Small/Mid Cap Value, Emerging Markets Equity, Global Large Growth, Global Large Blend, Global Large Value, Convertibles, High Yield Bond, Intermediate Core Bond, Intermediate Core-Plus Bond, Multisector Bond, Commodities Broad Basket, Commodities Focused.
All Domestic Equity: Large Cap Growth, Large Cap Blend, Large Cap Value, Mid Cap Growth, Mid Cap Blend, Mid Cap Value, SmallCap Growth, Small Cap Blend, Small Cap Value, Custom Disruptive Innovation peer group.
All Equity: Large Cap Growth, Large Cap Blend, Large Cap Value, Mid Cap Growth, Mid Cap Blend, Mid Cap Value, SmallCap Growth, Small Cap Blend, Small Cap Value, Custom Disruptive Innovation peer group, Foreign Large Cap Growth, Foreign Large Cap Blend, Foreign Large Cap Value, Foreign Small/Mid Cap Growth, Foreign Small/Mid Cap Blend, Foreign Small/Mid Cap Value, Emerging Markets Equity, Global Large Growth, Global Large Blend, Global Large Value.
All Fixed Income: Convertibles, High Yield Bond, Intermediate Core Bond, Intermediate Core-Plus Bond, Multisector Bond, Commodities Broad Basket, Commodities Focused.
All International Equity: Foreign Large Cap Growth, Foreign Large Cap Blend, Foreign Large Cap Value, Foreign Small/Mid Cap Growth, Foreign Small/Mid Cap Blend, Foreign Small/Mid Cap Value, Emerging Markets Equity.
Below definition of Index Fund or not, as cited below, are based on the 'Active Share' of the fund and the 'Tracking Error' it has compared to its benchmark.
Actively managed - for ETFs only. The data point applies to ETFs that are marked as neither Index Fund = Yes nor Enhhanced Index = Yes. It captures a newer class of products that are actively managed in the traditional sense that mutual funds are.
The corresponding data point for open end funds is: Index fund yes/no
Harbor Capital Advisors, Inc.
3129349


