 Contact
The Human Capital Factor®: Uncorrelated to Investment Styles & Factors
February 29, 2024


As investors increasingly prioritize diversification in pursuit of a well-balanced portfolio, we think distinctive factors that show low correlation to more traditional investment styles present compelling investment opportunities. One such factor, the Human Capital Factor® (HCF®), seeks to quantify levels of motivation and engagement of a company’s workforce in an effort to capture the powerful connection between human capital and stock performance. These HCF® scores assist in addressing a market inefficiency and afford access to a new alpha factor with differentiated excess return potential.
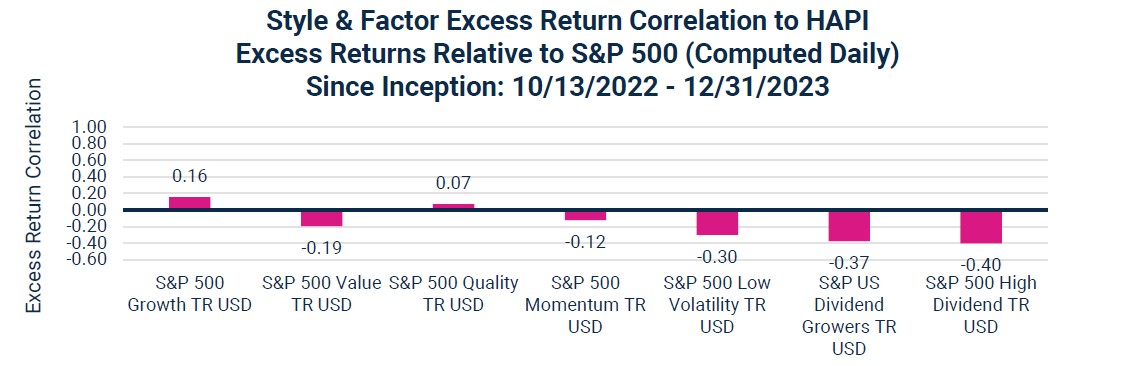
These distinct results have been on display since the October 2022 launch of the Harbor Human Capital Factor U.S. Large Cap ETF (ticker: HAPI), which seeks to track the CIBC Human Capital Index and uses the HCF® as a proprietary scoring factor. Beyond simply value and growth, HAPI has provided an excess return stream uncorrelated across investment styles and factors since its inception. The consistent lack of correlation or negative correlation to traditional styles and factors highlights the distinct nature of alpha driven by the HCF®.
Source: Morningstar Direct, December 2023. Performance data shown represents past performance and is no guarantee of future results.
| Average Annual Returns as of 12/31/2023 | 3 Months | YTD | 1 Year | Since Inception | Inception Date | Total Expense Ratio % |
| Harbor Human Capital Factor US Large Cap ETF (NAV) | 10.85% | 30.30% | 30.30% | 33.39% | 10/12/2022 | 0.36% |
| Harbor Human Capital Factor US Large Cap ETF (Market) | 10.85% | 30.30% | 30.30% | 33.39% | 10/12/2022 | 0.36% |
| CIBC Human Capital Index | 11.05% | 30.65% | 30.65% | 33.79% | 10/12/2022 | |
| S&P 500 Index | 11.69% | 26.29% | 26.29% | 28.68% | 10/12/2022 |
Performance data shown represents past performance at net asset value and is no guarantee of future results. Past performance is net of management fees and expenses and reflects reinvested dividends and distributions. Investment returns and principal value will fluctuate and when redeemed may be worth more or less than their original cost. Returns for periods less than one year are not annualized. Current performance may be higher or lower and is available through the most recent month end at harborcapital.com or by calling 800-422-1050. For the most current quarter or month end performance, please click HERE. The Fund’s returns achieved during certain periods shown were unusual and an investor should not expect such performance to be sustained.
On average across these factors and styles, the excess return correlation is -0.17. This indicates a distinct alpha factor, in our view, that has the potential to provide alpha uncorrelated to other investments in a broad portfolio. To learn more about HAPI, please visit our website.
Important Information
Risks
Investing involves risk, principal loss is possible. Unlike mutual funds, ETFs may trade at a premium or discount to their net asset value. Harbor ETFs are new and have limited operating history to judge.
Shares are bought and sold at market price not net asset value (NAV). Market price returns are based upon the closing composite market price and do not represent the returns you would receive if you traded shares at other times.
HAPI: There is no guarantee that the investment objective of the Fund will be achieved. Stock markets are volatile and equity values can decline significantly in response to adverse issuer, political, regulatory, market and economic conditions. The Fund may not exactly track the performance of the Index with perfect accuracy at all times. Tracking error may occur because of pricing differences, timing and costs incurred by the fund or during times of heightened market volatility. The Fund relies on the Index provider's methodology in assessing whether a company may be considered a corporate culture leader. There is no guarantee that the construction methodology will accurately assess a company to include or exclude it from the index which could have an adverse effect on the Fund's returns. The Fund's assets may be concentrated in a particular sector or industries to the extent the Index is concentrated and is subject to the risk that economic, political, or other market conditions that have a negative effect on that sector or industry will negatively impact the value of the Fund.
Companies in the information technology sector can be significantly affected by short product cycles, obsolescence of existing technology, impairment or loss of intellectual property rights, falling prices and profits, competition from new market entrants, government regulation and other factors.
Diversification does not assure a profit or protect against loss in a declining market.
The Harbor Human Capital Factor US Large Cap ETF seeks to provide investment results that correspond, before fees and expenses, to the performance of Canadian Imperial Bank of Commerce (“CIBC”) Human Capital Index. The CIBC Human Capital Index consists of a modified market-weighted portfolio of the equity securities of U.S. companies identified by Irrational Capital LLC (“Irrational Capital”) as those it believes to possess strong corporate culture based on its proprietary scoring methodology. Constituents eligible are chosen from Solactive GBS United States 500 Index (the “index universe”) at the time of Index reconstitution. The Solactive GBS United States 500 Index intends to track the performance of the largest 500 companies from the US stock market. The index listed is unmanaged and does not reflect fees and expenses and is not available for direct investment.
HCF Scoring: Each company in the universe is scored on each of the seven dimensions (organizational effectiveness, innovation, direct management, organizational alignment, engagement, emotional connection, and extrinsic rewards). In the examples provided above, eligible constituents are chosen from Solactive GBS United States 500 Index (the “index universe”) at the time of Index reconstitution. The Solactive GBS United States 500 Index intends to track the performance of the largest 500 companies from the US stock market. The index listed is unmanaged and does not reflect fees and expenses and is not available for direct investment. Scores across all seven dimensions are aggregated for each company. The raw score reflects aggregate scores across the seven dimensions for every company in the universe. The Z-score then serves to normalize the distribution of raw scores across the universe. A Z-score is a statistical measurement that tells you how far away from the mean (or average) your datum lies in a normally distributed sample. The Highest (most favorable) raw HCF® value is 3, the lowest (least favorable) raw HCF® value is -3.
The S&P 500 Index, or Standard & Poor's 500 Index, is a market-capitalization-weighted index of 500 leading publicly traded companies in the U.S. The S&P 500 Growth Index is a stock index that represents the fastest-growing companies in the S&P 500. The S&P 500 Pure Value Index (or S&P 500 Value Index) is an index comprised of the strongest value stocks on the S&P 500. The S&P 500 Quality Index is designed to track high quality stocks in the S&P 500 by quality score, which is calculated based on return on equity, accruals ratio and financial leverage ratio. The S&P 500 Momentum Index is designed to measure the performance of securities in the S&P 500 universe that exhibit persistence in their relative performance. The S&P 500 Low Volatility Index measures performance of the 100 least volatile stocks in the S&P 500. The index benchmarks low volatility or low variance strategies for the U.S. stock market. Constituents are weighted relative to the inverse of their corresponding volatility, with the least volatile stocks receiving the highest weights. The S&P U.S. Dividend Growers Index is designed to measure the performance of U.S. companies that have followed a policy of consistently increasing dividends every year for at least 10 consecutive years. The index excludes the top 25% highest-yielding eligible companies from the index. The S&P 500 High Dividend Index serves as a benchmark for income seeking equity investors. The index is designed to measure the performance of 80 high yield companies within the S&P 500 and is equally weighted to best represent the performance of this group, regardless of constituent size. The Russell 2000® index is a market index comprised of 2,000 small-cap companies. The Russell 2000® Index and Russell® are trademarks of Frank Russell Company.
These indices are unmanaged and do not reflect fees and expenses and are not available for direct investment.
The views expressed herein may not be reflective of current opinions, are subject to change without prior notice, and should not be considered investment advice or a recommendation to purchase a particular security.
Alpha refers to excess returns earned on an investment.
Correlation is a statistic that measures the degree to which two variables move in relation to each other.
3395493


