


Since 2020, U.S. large cap growth companies have outperformed their large cap value counterparts, as shown in the following chart.1 While industry observers have numerous opinions on why growth has outpaced value during this time period, one answer could be staring us in the face. On an earnings‑per‑share (EPS) basis, growth companies have simply grown faster than their value peers.
Index Growth & Estimated Earnings per Share Since 2020
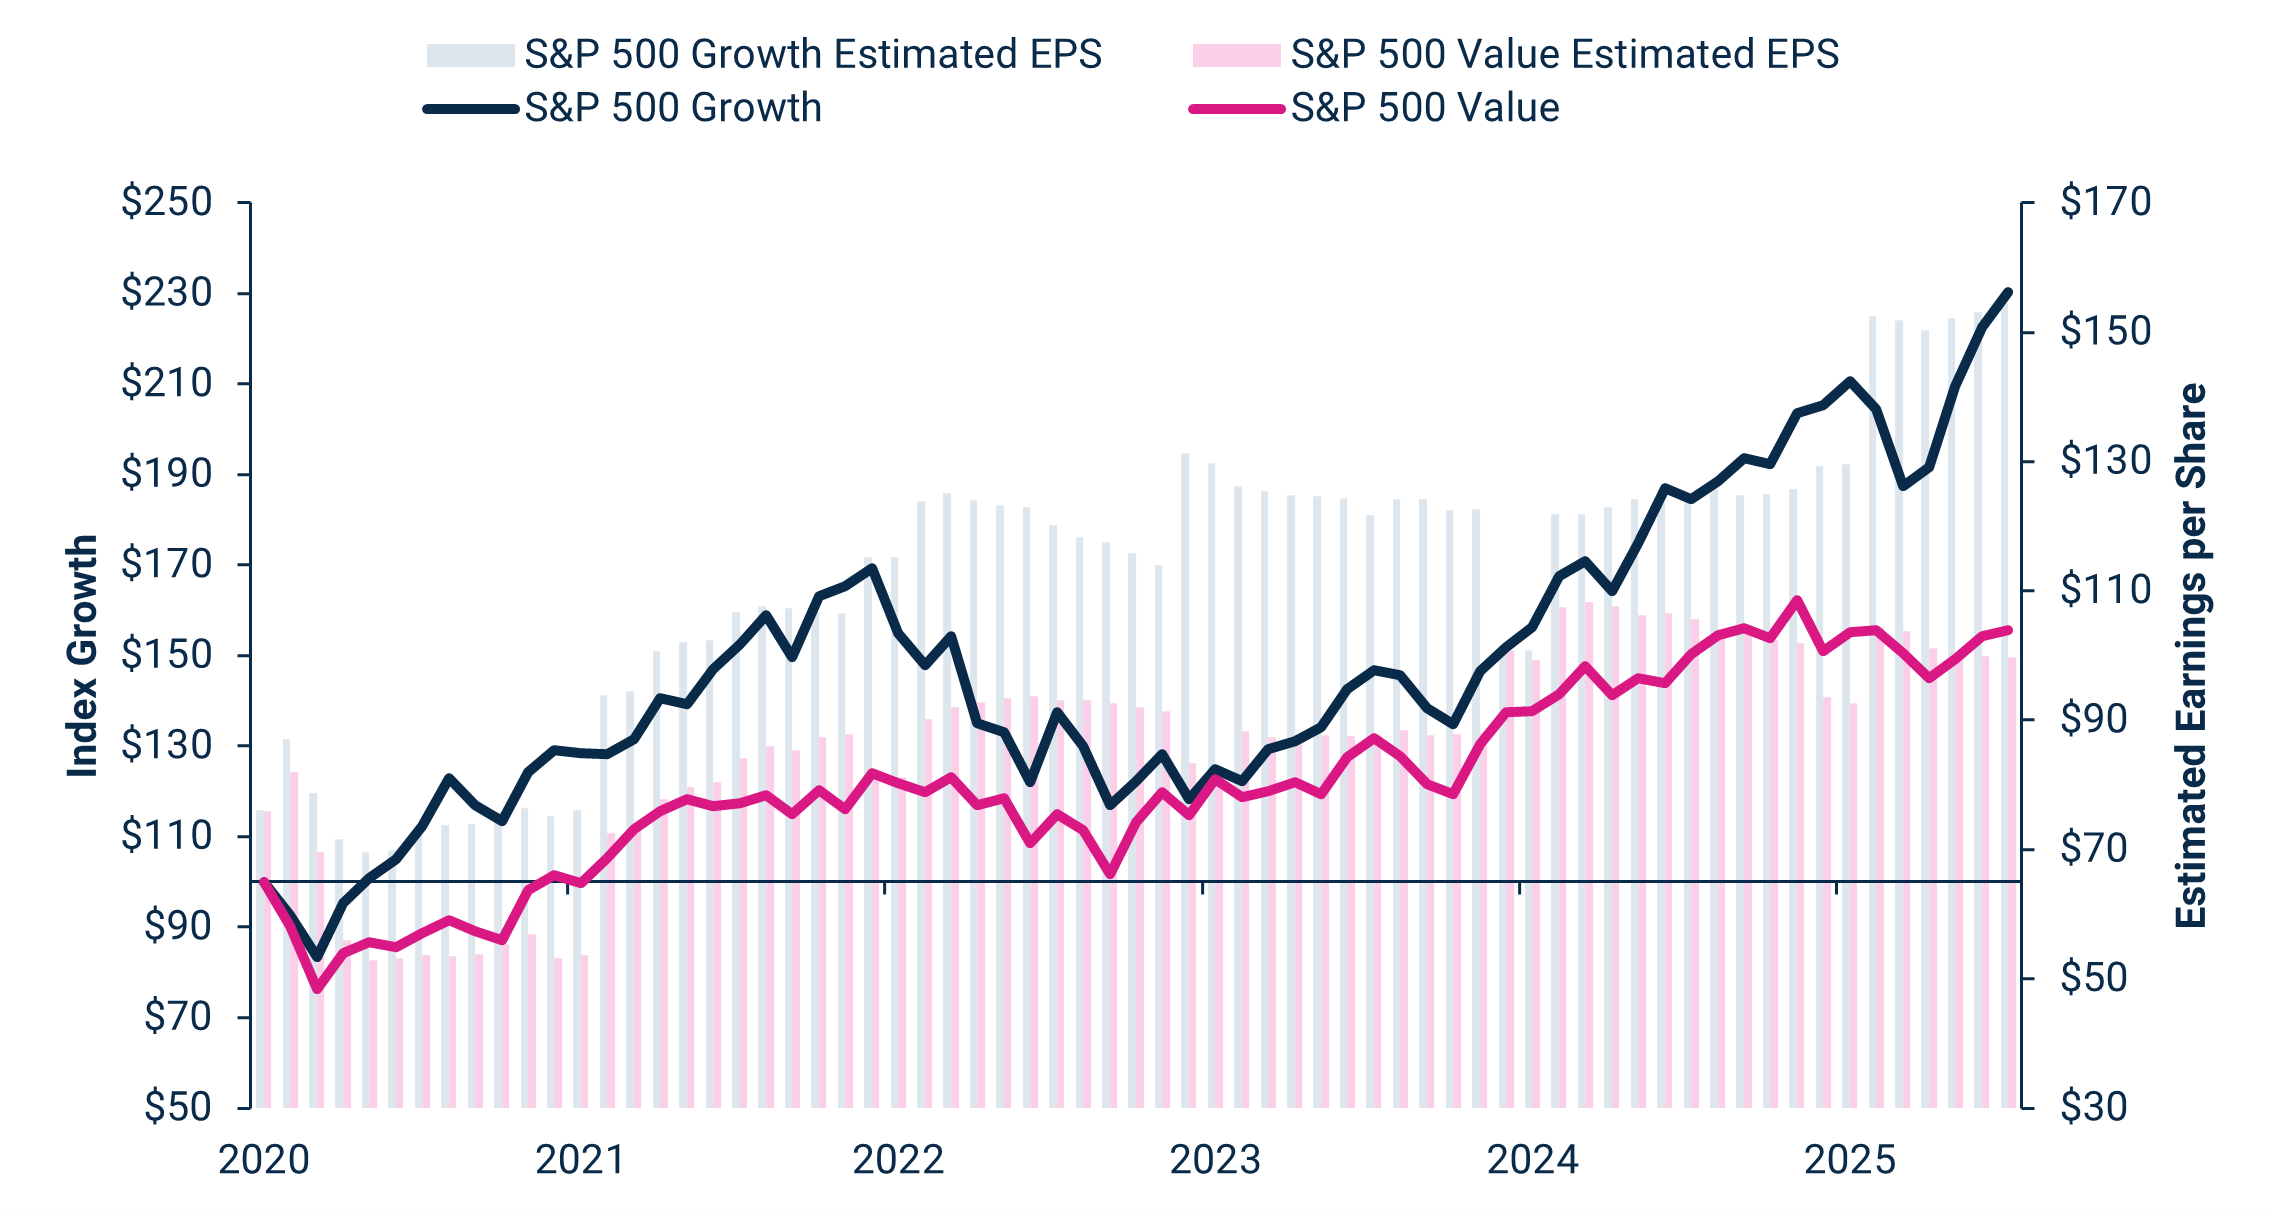
Data as of 08/31/2025. Source: Bloomberg. Performance data shown represents past performance and is no guarantee of future results. Estimated Earnings per Share and Estimated Long-Term Earnings Growth reflect the Bloomberg consensus estimate (mean) of sell-side analyst estimates. Index performance is represented by the S&P 500 Growth and S&P 500 Value price return indices.
By digging into the S&P 500 (shown in the chart that follows), we can see that growth stocks have higher long‑term estimated earnings growth than value stocks. Since 2020, this difference has contributed to the stronger performance for growth companies. While this trend may seem obvious (growth companies should by definition grow faster than value companies), growth has not always outperformed value. But for now, large cap growth may appear more attractive than large cap value on an asset class basis if similar EPS trends continue.
Estimated Long‑Term Earnings Growth
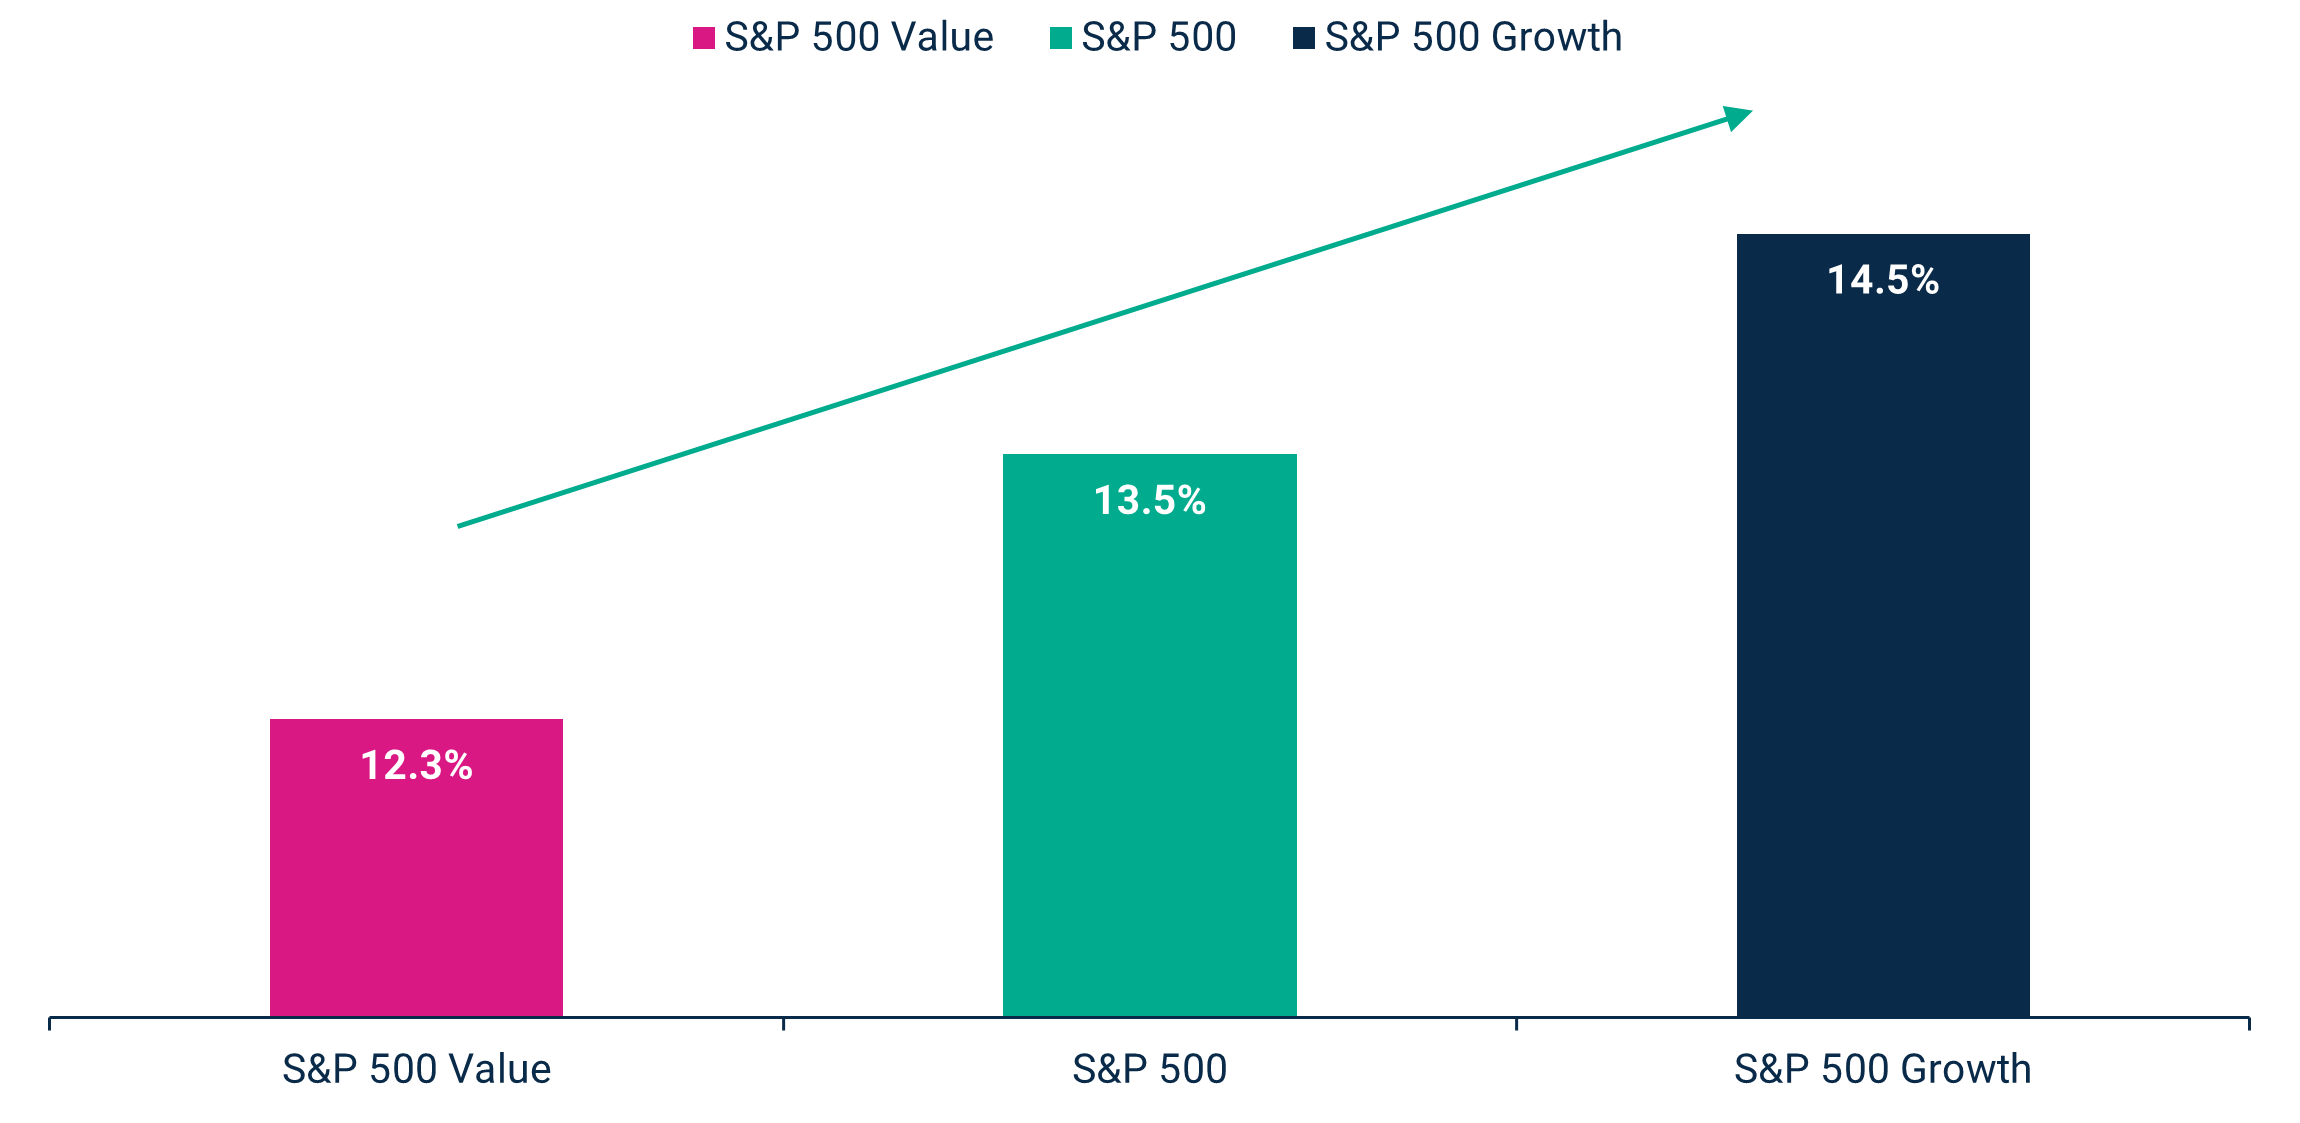
Data as of 08/31/2025. Source: Bloomberg. Performance data shown represents past performance and is no guarantee of future results. Estimated Earnings per Share and Estimated Long-Term Earnings Growth reflect the Bloomberg consensus estimate (mean) of sell-side analyst estimates. Historical performance is represented by the S&P 500 Growth and S&P 500 Value price return indices.
Next steps
For investors seeking to harness the growth potential of large cap growth stocks, it could be an opportune time for an increased allocation. That said, not all large cap growth managers are created equal. As companies face increasingly complex macroeconomic, geopolitical, and policy challenges, we believe that managers with deep research capabilities and a track record of navigating market cycles have the potential to stand out from the pack.
To learn more about Harbor’s analysis of the market environment as a whole and opportunities for prudent asset allocation, check out our weekly research presentation – The Current.
Important Information
1 Performance data shown represents past performance and is no guarantee of future results. U.S. large cap growth stocks are represented by the S&P 500 Growth Price Return Index. U.S. large cap value stocks are represented by the S&P 500 Value Price Return Index.
Risks
Investing entails risks and there can be no assurance that any investment will achieve profits or avoid incurring losses. Stock markets are volatile and equity values can decline significantly in response to adverse issuer, political, regulatory, market and economic conditions.
Diversification does not assure a profit or protect against loss in a declining market.
The S&P 500 Index is an unmanaged index generally representative of the U.S. market for large capitalization equities. The S&P 500 Value Index measures constituents from the S&P 500 that are classified as value stocks based on three factors: the ratios of book value, earnings, and sales to price. The S&P 500 Growth Index measures constituents from the S&P 500 that are classified as growth stocks based on three factors: sales growth, the ratio of earnings change to price, and momentum. Indices are unmanaged and do not reflect fees and expenses and are not available for direct investment.
This material is intended solely for educational purposes, and should not be construed as investment advice, a recommendation, or an offer or solicitation to purchase or sell any securities. The opinions expressed are as of the date(s) indicated and are subject to change without notice. Reliance upon information in this material is at the sole discretion of the reader. Investing involves risks, including the risk of loss. This information is not intended to be complete or exhaustive and no representations or warranties, either express or implied, are made regarding the accuracy or completeness of the information contained herein. This material may contain estimates and forward‑looking statements, which may include forecasts, and do not represent a guarantee of future performance. Past performance does not guarantee future results. Investors should consult with a financial professional before making any investment decisions.
Earnings per share (EPS) is a company's net income subtracted by preferred dividends and then divided by the number of common shares it has outstanding.
The views expressed herein may not be reflective of current opinions, are subject to change without prior notice, and should not be considered investment advice or a recommendation to purchase a particular security.
Copyright © 2025 Harbor Capital Advisors, Inc. All rights reserved.
4839053