


The AI boom has propelled markets higher, but winners and losers could be lurking beyond the obvious places.
What’s happening in markets:
The transformational power of AI has driven early beneficiaries to high valuations, but some software companies could suffer from AI advances, while the potential for sectors beyond tech to benefit may not yet be fully understood.
Why it matters for portfolios:
Most portfolios are already heavily exposed to AI, but in a far more concentrated way than advisors and investors may realize. Valuation‑focused investors can look beyond big tech names to AI infrastructure stocks in areas such as networking, power, cooling, optics, developer tools, logistics, and real estate.
How to think about it:
As AI continues to shape markets, advisors should look to active strategies that can help navigate widening dispersion and the growing divide between potential winners and losers.
Source: Harbor Capital Advisors; as of 3/31/2026.
AI Has Dominated Equity Markets Since 2022 – But Not Everyone is a Winner
AI has created broad dispersion, leading to vastly different outcomes for a range of AI‑exposed companies.
UBS AI Winners, AI Adopters, and AI Risk vs. S&P 500
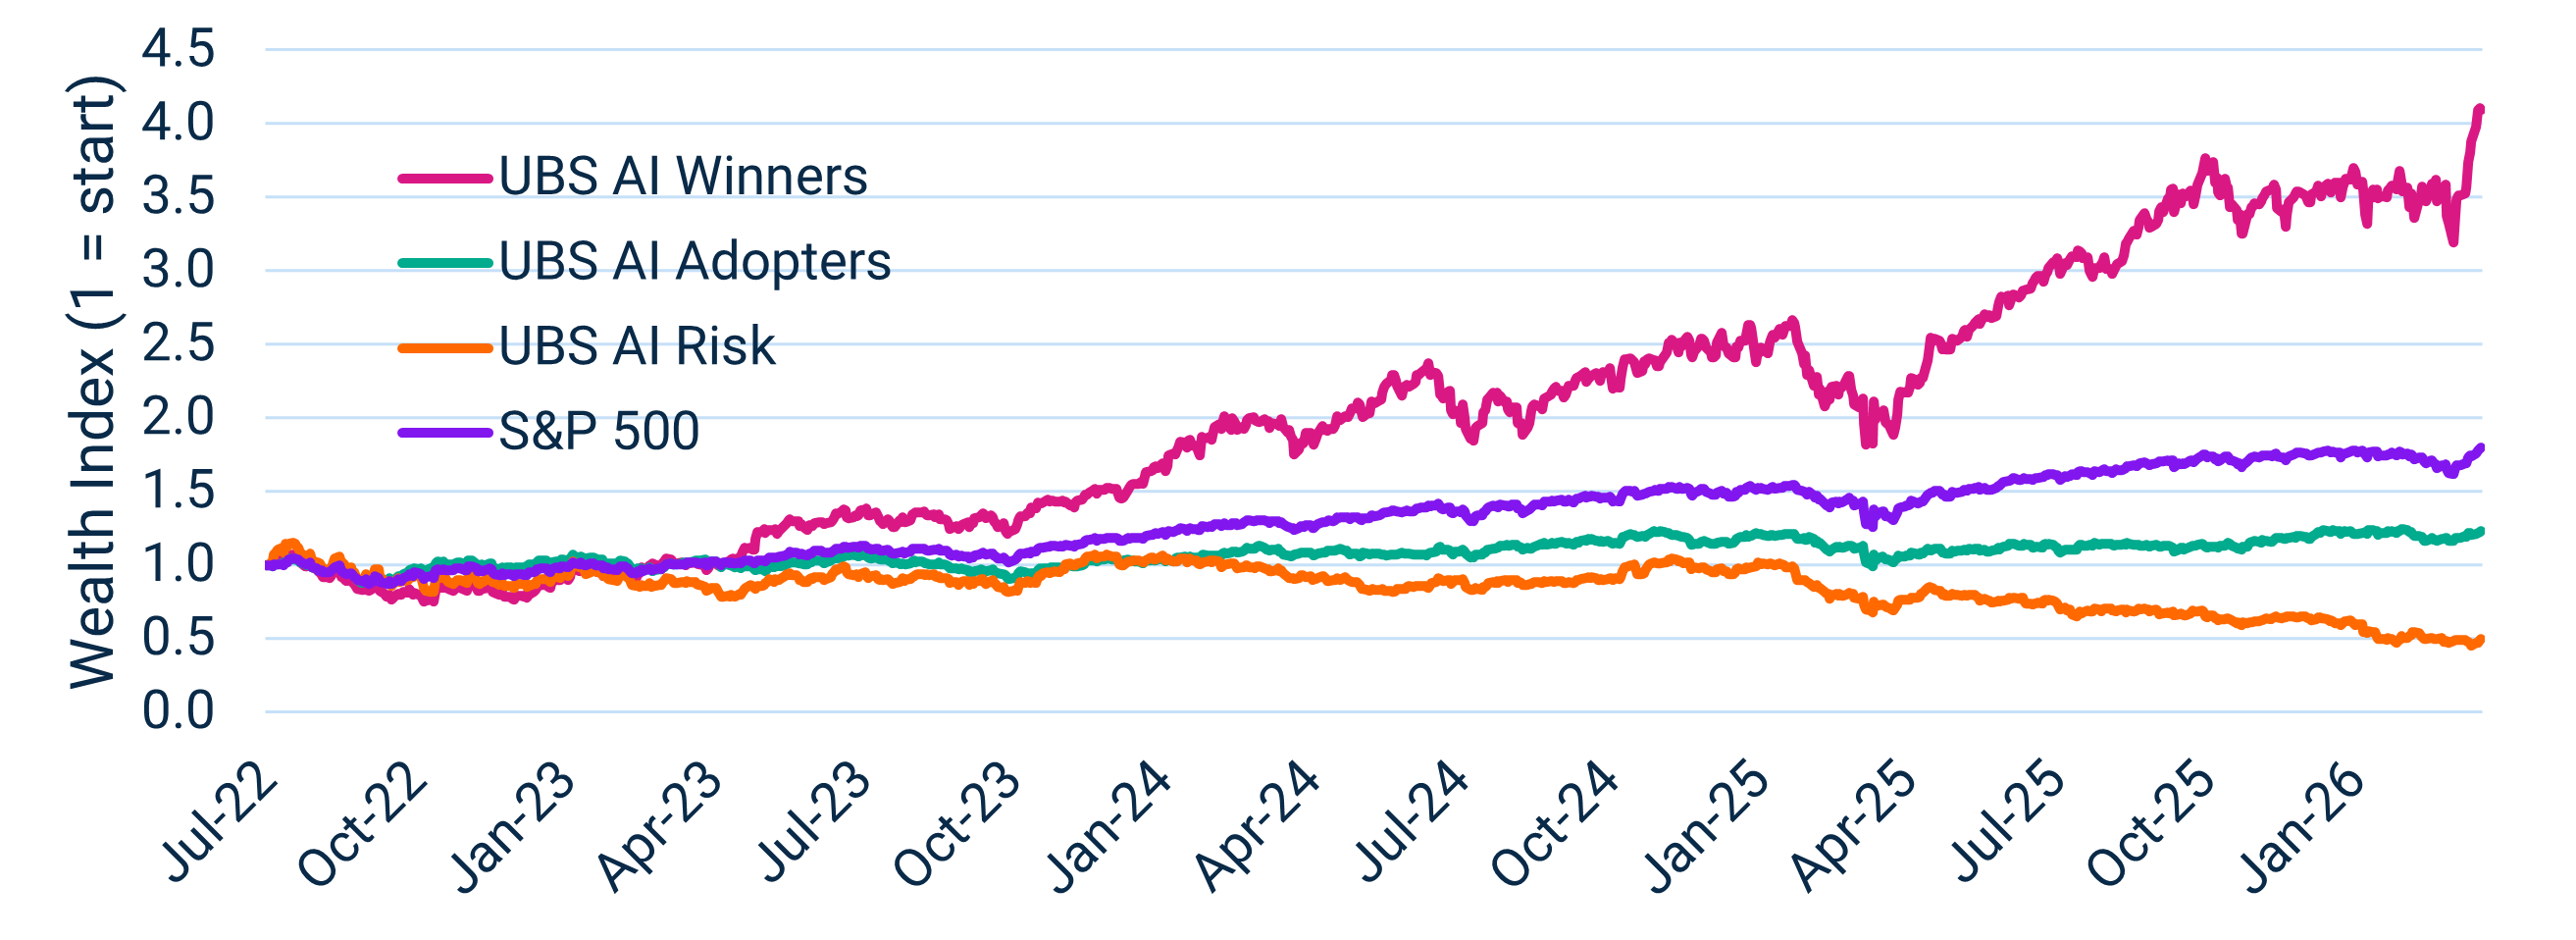
Data from 8/1/2022 (common data inception) through 4/16/2026. Source: Bloomberg, FactSet. Performance data shown represents past performance and is no guarantee of future results. The 'Wealth Index' represents the compound return assuming a starting value of 1.0. AI Winners, AI Adopters, and AI At-Risk represented by the UBS AI Winners, UBS AI Adopters and UBS AI At-Risk baskets, respectively. The UBS AI Winners basket tracks the performance of the 55 US-listed stocks at the forefront of the Generative AI industry. Stock selection is based on input from UBS research analysts, specialty sales, and transcripts/reports. The basket has been optimized for liquidity with initial weights capped at 10% (NVDA) and 4% (all other members). The UBS AI Adopters basket tracks the performance of non-Tech stocks best paced to reap productivity gains from adopting AI. Excludes AI infrastructure and enabler stocks. Industries include: Financials, Freights, Consumer & Health Care. Constituent companies are data-rich and/or provide labor-intensive services. Liquidity optimized with a 2.5% cap. The UBS AI Risk basket tracks the performance of US-listed stocks debated as potentially at risk of disruption from AI. Sub-groups include Application Software, IT Services, Staffers, Advertisers, Education Services and Content Generators. The basket has been optimized for liquidity with initial weights capped at 4%. Disclaimer: www.ubs.com/custom-baskets-terms-of-use. S&P 500 is represented by the S&P 500 Total Return.
Looking Under the Hood of AI Winners, Adopters, and At‑Risk Companies
AI Winners have had higher valuation and expected growth rates but still lower Price/Earnings‑to‑Growth (PEG) ratios than the Russell 3000 Index.
Winners
Adopters
Risk
3000
Index
Winners
Adopters
Risk
P/E
(projected)
3-5 Yr
EPS
Months
EPS
Months
Sales
3-5 Yr
EPS
Months
EPS
Months
Sales
Active management could be critical to determine a long‑term fundamental view beyond the horizon of consensus estimates and use that view to determine appropriate valuation, both for perceived winners and at‑risk companies.
Data as of 3/31/2026. Source: Bloomberg, FactSet. Performance data shown represents past performance and is no guarantee of future results. AI Winners, AI Adopters, and AI At-Risk represented by the stocks in the UBS AI Winners, UBS AI Adopters and UBS AI At-Risk baskets, respectively, which stocks are then weighted by market capitalization within each basket to derive the valuation and growth characteristics. The UBS AI Winners basket tracks the performance of the 55 US-listed stocks at the forefront of the Generative AI industry. Stock selection is based on input from UBS research analysts, specialty sales, and transcripts/reports. The basket has been optimized for liquidity with initial weights capped at 10% (NVDA) and 4% (all other members). The UBS AI Adopters basket tracks the performance of non-Tech stocks best paced to reap productivity gains from adopting AI. Excludes AI infrastructure and enabler stocks. Industries include: Financials, Freights, Consumer & Health Care. Constituent companies are data-rich and/or provide labor-intensive services. Liquidity optimized with a 2.5% cap. The UBS AI Risk basket tracks the performance of US-listed stocks debated as potentially at risk of disruption from AI. Sub-groups include Application Software, IT Services, Staffers, Advertisers, Education Services and Content Generators. The basket has been optimized for liquidity with initial weights capped at 4%. Disclaimer: www.ubs.com/custom-baskets-terms-of-use. Russell 3000 Index is represented by the Russell 3000 Total Return. PEG Ratio stands for Price/Earnings divided by growth rate.
Digging into Sectors Highlights Areas at Risk
Percent of companies within AI Winners, AI Adopters, and AI At‑Risk within each sector followed by industries within Information Technology and Industrials sectors.
Winners
Adopters
At-Risk
Winners
Adopters
At-Risk
Winners
Adopters
At-Risk
Data as of 3/31/2026. Source: Bloomberg, FactSet. Performance data shown represents past performance and is no guarantee of future results. AI Winners, AI Adopters, and AI At-Risk represented by the stocks in the UBS AI Winners, UBS AI Adopters and UBS AI At-Risk baskets, respectively, which stocks are then equal weighted within each basket to determine the percent of companies within each GICS sector and GICS industry. The UBS AI Winners basket tracks the performance of the 55 US-listed stocks at the forefront of the Generative AI industry. Stock selection is based on input from UBS research analysts, specialty sales, and transcripts/reports. The UBS AI Adopters basket tracks the performance of non-Tech stocks best paced to reap productivity gains from adopting AI. Excludes AI infrastructure and enabler stocks. Industries include: Financials, Freights, Consumer & Health Care. Constituent companies are data-rich and/or provide labor-intensive services. The UBS AI Risk basket tracks the performance of US-listed stocks debated as potentially at risk of disruption from AI. Sub-groups include Application Software, IT Services, Staffers, Advertisers, Education Services and Content Generators. Disclaimer: www.ubs.com/custom-baskets-terms-of-use.
AI Winners Include Both AI Direct Beneficiaries and AI Infrastructure Companies
A deeper look within each category of potential beneficiaries.
examples
Beneficiaries
Data as of 3/31/2026. Source: company websites. 1Hanwha Data Centers: “What are the Power Requirements for AI Data Centers”, November 12, 2025. 2Schneider Electric: “When air isn’t enough: The liquid cooling revolution”, January 30, 2026. 3NVIDIA, “NVIDIA Ethernet Networking Accelerates World’s Largest AI Supercomputer, Built by xAI”, October 28, 2024.
AI Infrastructure Provides More Differentiated Characteristics Than AI Direct Beneficiaries
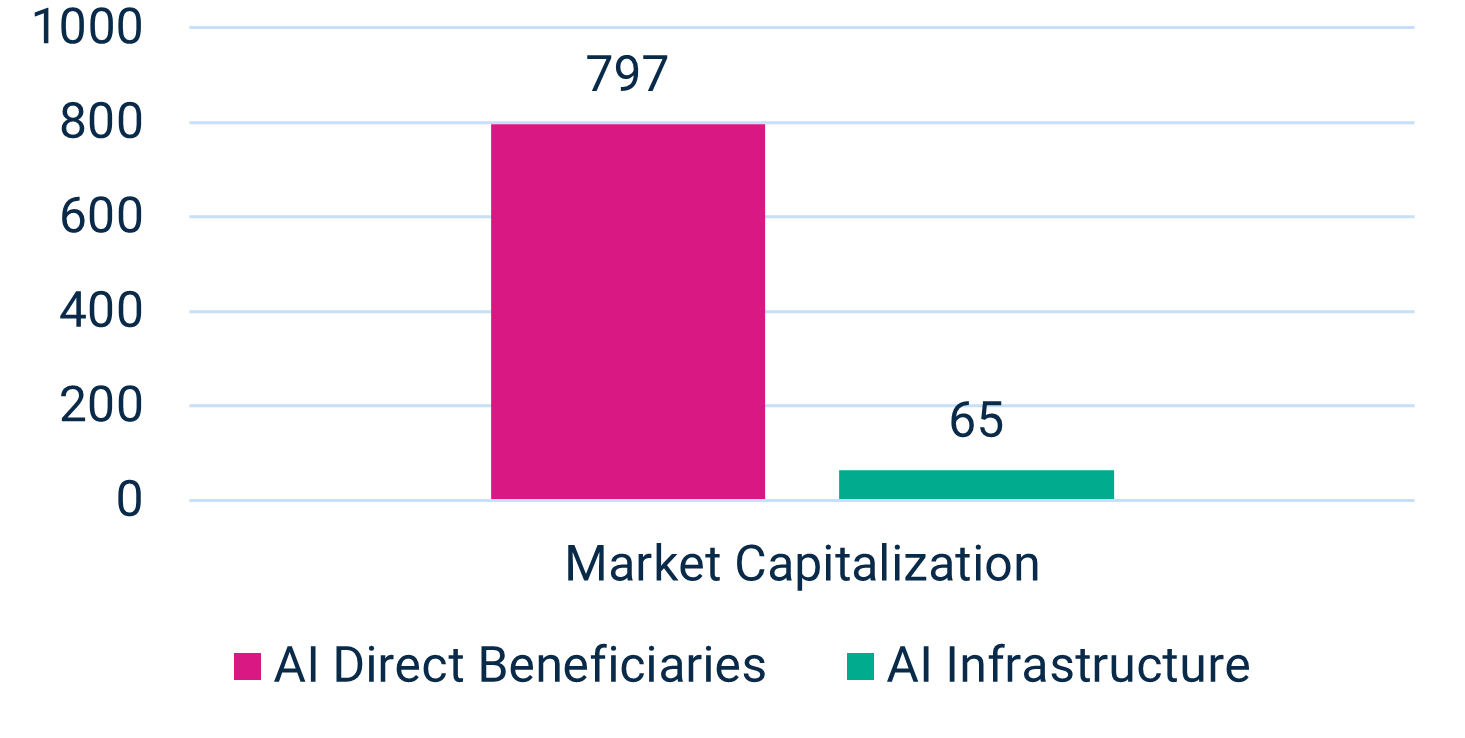
AI Infrastructure could offer a wider range of opportunities for the next cycle of AI growth, with lower market caps and cheaper valuations.
Holdings spread more evenly across more sectors.
Average market capitalization is less than a tenth the size.
Average Market Capitalization (USD bn)
Same expected long‑term EPS growth but lower valuation based on Price/Cash Flow.
Price / Cash Flow and Est 3‑5 Year EPS Growth
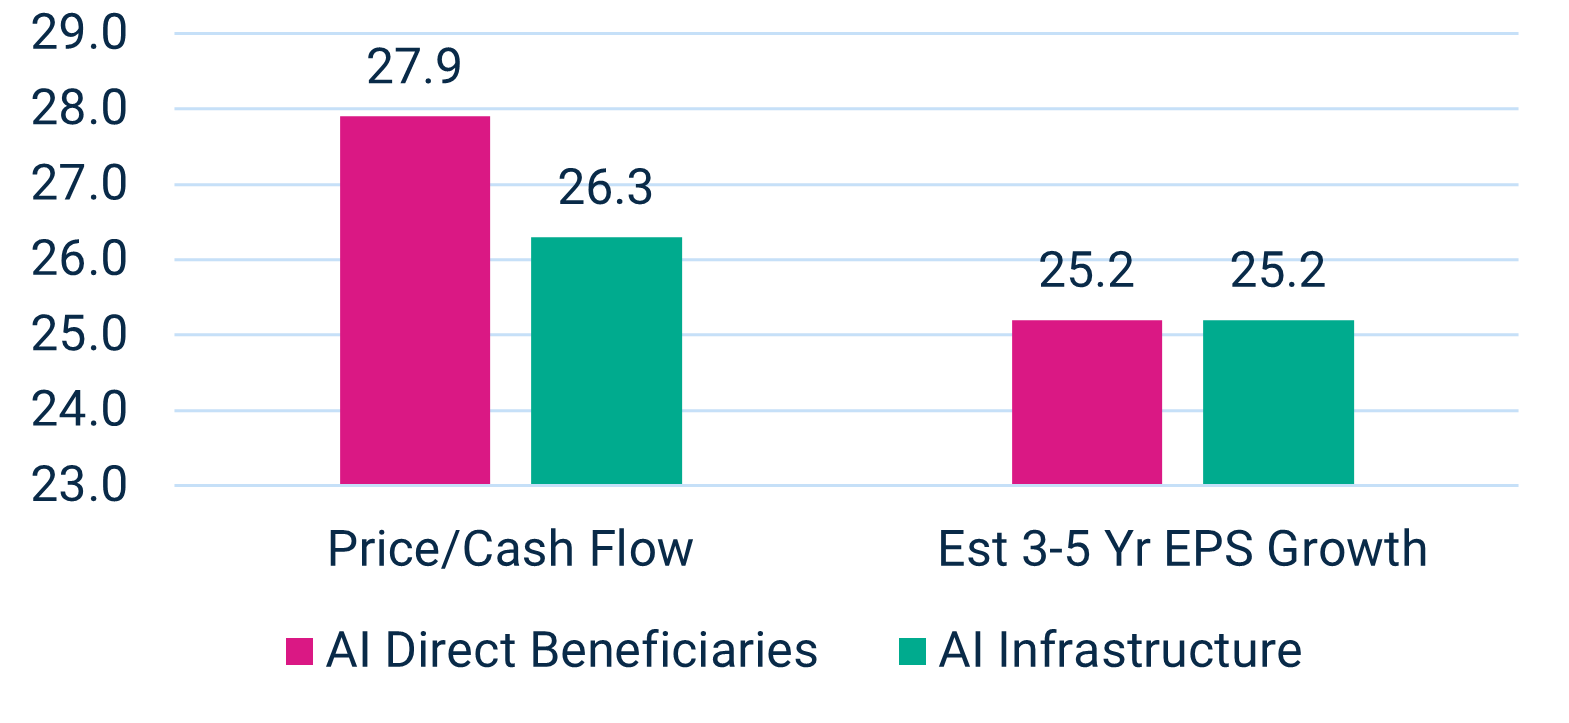
Data as of 3/31/2026. Source: FactSet. Performance data shown represents past performance and is no guarantee of future results. AI Winners basket broken out into AI Direct Beneficiaries and AI Infrastructure baskets, equal-weighted, as follows: Ai Direct Beneficiaries includes the Semiconductors & Semiconductor Equipment, Technology Hardware Storage & Peripherals, Software and IT Services GICS industries within the GICS IT sector, the Interactive Media & Services GICS industry within the GICS Communication Services sector, and the Automobiles and Broadline Retail GICS industries within the GICS Consumer Discretionary sector; AI Infrastructure includes the Electronic Equipment Instruments & Components and Communications Equipment GICS industries within the GICS IT sector, and the Industrials, Utilities and Real Estate GICS sectors. Price / Cash flow calculated using weighted harmonic average, and Est 3-5 Yr EPS Growth calculated using weighted average.
Important Information
Index Definitions:
The S&P 500 Index is an unmanaged index generally representative of the U.S. market for large capitalization equities.
The Russell 3000® Index is an unmanaged index that measures the performance of the largest 3000 U.S. companies representing approximately 98% of the investable U.S. equity market. The Russell 3000® Index is constructed to provide a comprehensive, unbiased and stable barometer of the broad market and is completely reconstituted annually to ensure new and growing equities are reflected. The Russell 3000® Index and Russell® are trademarks of Frank Russell Company.
These unmanaged indices do not reflect fees and expenses and are not available for direct investment.
The views expressed herein may not be reflective of current opinions, are subject to change without prior notice, and should not be considered investment advice or a recommendation to purchase a particular strategy.
Stock markets are volatile and equity values can decline significantly in response to adverse issuer, political, regulatory, market and economic conditions.
Investing entails risks and there can be no assurance that any investment will achieve profits or avoid incurring losses.
Diversification does not assure a profit or protect against loss in a declining market.
This material may contain forward‑looking information that is not purely historical in nature. Such information may include, among other things, projections and forecasts. There is no guarantee that any of these views will come to pass.
Copyright ©2026 Harbor Capital Advisors, Inc. All rights reserved.