


.webp)
We believe breadth, not concentration, delivers what the core allocation actually needs.
Key Takeaways
- We believe the core must aim to balance excess return with benchmark awareness. A core allocation that adds no value is hard to justify, but one that swings too far from its benchmark can be hard for clients to hold.
- Breadth appears to improve that balance. Across the categories tested, tracking error compressed as holdings counts rose. The most-diversified quintile posted annual excess return standard deviations of 2.0% to 2.3%, versus 3.9% to 6.9% for the most-concentrated quintile.
- Narrower outcomes historically improved the client experience. In Morningstar’s U.S. Large Blend, 84% of annual results for the highest-holdings funds landed within +/-3% of the benchmark, compared with 38% for the lowest-holdings funds. That gap separates a core allocation that behaves like a core from one that puts client conviction to the test.
- We believe concentrated active belongs in the satellite. Wider dispersion appears to be an asset when it is intentional and sized appropriately. In the core, that same dispersion can erode the stability clients expect and the staying power portfolios need.
Most allocators face the same tension. Clients want excess return, but we believe staying invested can be challenging when their fund is having a difficult year relative to its benchmark. The conventional solution to these competing objectives is a core‑and‑satellite structure. The satellite holds concentrated, high‑conviction positions, where the trade‑off is wider dispersion, meaning annual results that swing more widely around the benchmark in either direction. The core carries a different mandate: seeking to deliver benchmark‑relative stability and meaningful returns across market conditions. Importantly, "core" is defined within each asset class or sub‑asset class. An equity core is measured against its equity benchmark; a high yield core is measured against its high yield benchmark.
In every sleeve, the open question is which of three strategies (passive, concentrated discretionary, or systematic) belongs in the core and which in the satellite. Passive funds aim to track the benchmark and, by definition, produce no excess return. Concentrated discretionary funds often chase excess return with swings wide enough to test client conviction. Systematic strategies look to promise both: numerous small bets across hundreds of names, in pursuit of a modest, persistent edge without sacrificing stability.
Our analysis of ten years of Morningstar data indicates that systematic strategies have historically delivered. Across 4,788 fund‑year observations between 2016 and 2025 in active U.S. Large Blend, Foreign Large Blend, and U.S. High Yield Bond, the most concentrated managers ran two to three times the tracking error of their broadest peers. We believe it is best to build the core on strategies that offer breadth.
Systematic Strategies Typically Hold Many Names
Many systematic strategies seek to apply economically intuitive signals consistently across a broad universe, with risk controls that prevent unintended sector and factor exposures. In equity, that means valuation, profitability, earnings revisions, and momentum. In credit, carry, credit quality, and momentum.
Morningstar does not reliably identify which managers are discretionary and which are systematic, so we use holdings count as a proxy.1 We recognize this is a imperfect measure. A fund with many holdings is not necessarily systematic, and a fund with fewer holdings is not necessarily discretionary. Still, we believe the approach is reasonable because many systematic managers tend to express their skill through breadth, while concentrated discretionary managers tend to express their skill through fewer, larger positions.
We avoid other potential classifications for practical reasons. Self‑reported labels may be inconsistent, and tracking error is circular because it is one of the outcomes we are trying to evaluate. Holdings count, by contrast, is observable, comparable across funds, and closely tied to the way systematic and concentrated strategies typically take active risk. One limitation deserves mention: holdings count and tracking error are mechanically related, since all else equal, a fund holding many names will track its benchmark more closely regardless of its process. Our claim is therefore not that breadth proves a systematic process, but that breadth delivers the return profile a core allocation requires, and that systematic managers pursue breadth by design.
Within each category and year, we rank funds by holdings count and divide them into quintiles. The lowest‑holdings quintile (Q1) serves as our proxy for concentrated active strategies. The highest‑holdings quintile (Q5) serves as our proxy for broad, systematic‑oriented strategies. This does not perfectly classify every fund, but we believe it gives us a practical way to test whether greater breadth is associated with a tighter, and more core‑like return experience.
Breadth Tightens The Distribution
Funds that hold more names track the benchmark more closely, appear to swing less from year to year, and post fewer misses.
Exhibit 1: Distribution of annual excess returns by holdings quintile (2016‑2025)
Annual Excess Return by Holdings Quintile
Quintiles assigned within each Morningstar category-year
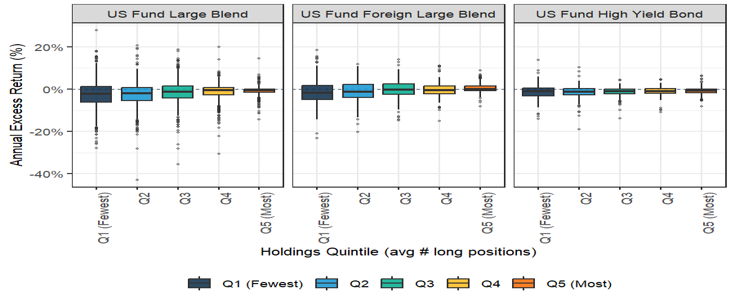
Source: Morningstar Direct and Harbor Capital Advisors calculations. Analysis includes open-end funds and ETFs within the Morningstar categories U.S. Fund Large Blend, U.S. Fund Foreign Large Blend, and U.S. Fund High Yield Bond, including surviving and non-surviving funds. Holdings quintiles were assigned independently within each Morningstar category and calendar year based on average monthly holdings counts. Excess return data reflects the Morningstar Direct “Excess Return” field measured relative to each category’s assigned Morningstar Index benchmark. Box plots display median excess return, interquartile range, and distribution tails by holdings quintile. Funds with fewer than six months of holdings data in a given calendar year were excluded from that year’s analysis. Past performance is not indicative of future results.
In a typical year, systematic funds (Q5) deliver excess returns within about 2.0% to 2.3% of the benchmark. Concentrated funds (Q1) swing 3.9% to 6.9% either way. This compression tends to be most pronounced in equity. High yield credit behaves similarly, but with smaller magnitudes, because high yield as an asset class is less volatile than equities.
We believe the mechanism is intuitive. A few large bets produce wide swings around the average. Many small bets, applied with the same skill, have produced tighter outcomes. The Fundamental Law of Active Management which states that a manager’s ability to generate excess returns depends on both the quality of their skill and the number of independent investment decisions they make, formalized this decades ago; systematic strategies put it into practice.
We Believe Wide Misses Break Client Conviction
We believe statistical dispersion translates directly into client experience. How often a fund posts large benchmark‑relative misses, and especially meaningful underperformance, often determines whether a portfolio survives a difficult year intact.
Exhibit 2: Frequency of extreme excess return years by holdings quintile
Frequency of Extreme Excess Return Years by Holdings Bucket
Extreme - |annual excess return| > 5% (3% for US Fund High Yield Bond)
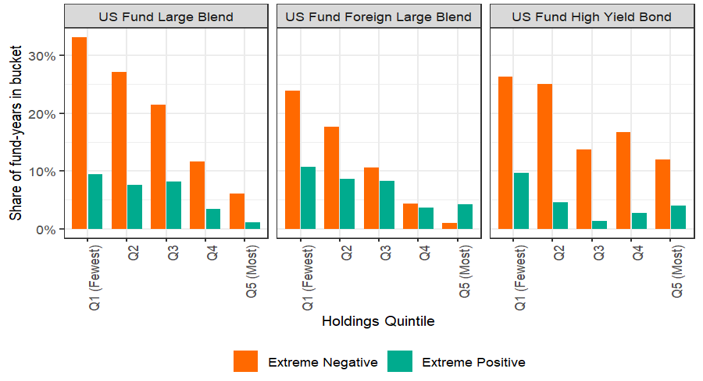
Source: Morningstar Direct and Harbor Capital Advisors calculations, June 2026. Analysis includes open-end funds and ETFs within the Morningstar categories U.S. Fund Large Blend, U.S. Fund Foreign Large Blend, and U.S. Fund High Yield Bond, including surviving and non-surviving funds. Holdings quintiles were assigned independently within each Morningstar category and calendar year based on average monthly holdings counts Extreme years are defined as calendar years in which Morningstar Direct “Excess Return” exceeded +5% or fell below -5% relative to the applicable Morningstar Index benchmark, except for U.S. Fund High Yield Bond, where extreme years are defined as excess returns above +3% or below -3%. Percentages shown represent the share of fund-year observations within each holdings quintile meeting those thresholds. Funds with fewer than six months of holdings data in a given calendar year were excluded from that year’s analysis. Past performance is not indicative of future results.
We note that clients do not experience tracking error as a statistical concept. They experience it as underperformance, during the years a manager trails by 8% or 10%, and they often capitulate before any skill is realized. The mechanism is predictable: loss aversion makes the pain of those trailing years roughly twice as acute as the pleasure of comparable outperformance, while recency bias tends to lead clients to extrapolate the recent shortfall indefinitely into the future. Together they convert a temporary, statistically expected drawdown into what feels like permanent evidence of failure.
In U.S. Large Blend, concentrated funds (Q1) produced excess returns beyond plus or minus 5% of the benchmark in nearly half of fund‑years. Among systematic funds (Q5), the figure falls into the single digits. Foreign Large Blend follows the same pattern. High yield credit looks different but is no less risky behaviorally. Because credit returns are structurally tighter than equity returns, we define an extreme year in high yield as a miss beyond +/‑3% rather than +/‑5%. Coupon income buffers experienced returns, but a fixed income sleeve trailing its benchmark by 200 to 300 basis points is its own retention problem, particularly for clients holding credit for predictability rather than upside.
We believe a tighter core, in equity or in credit, reduces difficult conversations, supports retention, and lets the rest of the portfolio take risk deliberately.
The Pattern Has Appeared to Have Held Year After Year
Single‑year dispersion compounds. The year‑over‑year hit rate within benchmark‑relative bands separates the candidates most clearly.
Exhibit 3: Probability of annual excess returns within +/‑3% of benchmark
Probability of Excess Return Within +/- 3% by Holdings Bucket
Higher = more consistent year-to-year tracking near benchmark
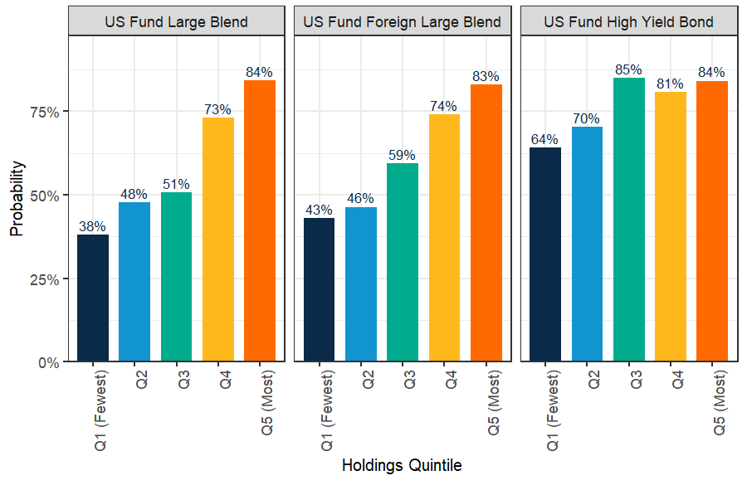
Source: Morningstar Direct and Harbor Capital Advisors calculations, June 2026. Analysis includes open-end funds and ETFs within the Morningstar categories U.S. Fund Large Blend, U.S. Fund Foreign Large Blend, and U.S. Fund High Yield Bond, including surviving and non-surviving funds. Holdings quintiles were assigned independently within each Morningstar category and calendar year based on average monthly holdings counts. Percentages shown represent the share of fund-year observations within each holdings quintile with Morningstar Direct “Excess Return” within ±3% of the applicable Morningstar Index benchmark. Funds with fewer than six months of holdings data in a given calendar year were excluded from that year’s analysis. Past performance is not indicative of future results.
In U.S. Large Blend, 38% of fund‑years in concentrated funds (Q1) finished within 3% of the benchmark; for systematic funds (Q5), 84%. Foreign Large Blend moves from 43% to 83%. High yield runs on a narrower axis, with hit rates already higher because credit dispersion is structurally tighter. That is a categorical shift in what the allocation actually delivers.
A Potential Home For a Variety of Strategies
If the only goal were minimizing tracking error, passive would be the obvious answer, and for some allocators it is the right one. But passive resolves the core's tension by abandoning one side of it: an index fund delivers the benchmark's return, minus fees, with no possibility of excess return.
We believe the case for a systematic core rests on the view that breadth does not require giving up the pursuit of excess return altogether. By spreading many small, independent decisions across hundreds of names, systematic strategies seek a modest, persistent edge while keeping benchmark‑relative swings within a range clients can live with.
That said, we believe both concentrated and systematic strategies belong in the portfolio; they simply belong in different places. Systematic strategies belong in the core, where breadth balances benchmark awareness with the pursuit of excess return. Concentrated discretionary funds belong in the satellite, where wider dispersion is the active risk being purchased, provided the allocation is sized appropriately and clients understand the range of outcomes.
Concentrated funds may produce exceptional years, but they also raise the risk of painful misses. Systematic strategies tend to give up some upside in exchange for greater consistency and behavioral durability. Blending both may help allocators pursue excess returns while keeping the overall portfolio one clients can hold through difficult years.
For more information on Harbor’s perspective on systematic investing and some options that may be appropriate for your portfolio, please email info@harborcapital.com or contact us at 1-800-427-2677.
Methodology Note
Analysis covers 4,788 fund‑year observations across three Morningstar categories from 2016 through 2025: active U.S. Fund Large Blend, active U.S. Fund Foreign Large Blend, and active U.S. Fund High Yield Bond. Quintiles assigned within each category and year. Excess return is calculated as annual fund return minus category benchmark return. Funds with fewer than six months of holdings data in a given year were excluded. Holdings count is a proxy for systematic versus discretionary process, not a strict definition. Holdings count is also mechanically related to tracking error; see the discussion of proxy limitations on page 2. Past performance is not indicative of future results.
Important Information
1 For fixed income funds, the number of issuers would generally be a better proxy than holdings count, since a single issuer may have multiple securities outstanding. However, due to data limitations, issuer‑level counts are not consistently available across the full sample.
Loss aversion and the asymmetric weighting of losses relative to gains were formalized in Kahneman and Tversky's prospect theory (1979); recency bias describes the tendency to overweight recent outcomes when forming expectations about the future. In combination they help explain "capitulation"—the clustering of investor exits near performance troughs.
Investing entails risks and there can be no assurance that any investment will achieve profits or avoid incurring losses
Stock markets are volatile and equity values can decline significantly in response to adverse issuer, political, regulatory, market and economic conditions.
Investing in international and emerging markets poses special risks, including potentially greater price volatility due to social, political and economic factors, as well as currency exchange rate fluctuations. These risks are more severe for securities of issuers in emerging market regions.
Fixed income investments are affected by interest rate changes and the creditworthiness of the issues held by the portfolio. As interest rates rise, the values of fixed income securities held by a portfolio are likely to decrease and reduce the value of the portfolio. High‑yield investing poses additional credit risk related to lower‑rated bonds.
The views expressed herein are those of Harbor Capital as of June 2026. These views are subject to change at any time based upon market or other conditions, and the author/s disclaims any responsibility to update such views. These views may not be relied upon as investment advice and, because investment decisions are based on many factors, may not be relied upon as an indication of trading intent. The discussion herein is general in nature and is provided for informational purposes only. There is no guarantee as to its accuracy or completeness. Past performance is no guarantee of future results.
The views expressed herein are those of Harbor as of June 2026. These views are subject to change at any time based upon market or other conditions and Harbor disclaims any responsibility to update such views. These views may not be relied upon as investment advice and, because investment decisions are based on many factors, may not be relied upon as an indication of trading intent. The discussion herein is general in nature and is provided for informational purposes only. There is no guarantee as to its accuracy or completeness. Past performance is no guarantee of future results.
© 2026 Morningstar, Inc. All rights reserved. The information contained herein:(1) is proprietary to Morningstar and/or its content providers; (2) may not be copied or distributed; and (3) is not warranted to be accurate, complete, or timely. Neither Morningstar nor its content providers are responsible for any damages or losses arising from any use of this information. Past performance is no guarantee of future results.
Diversification does not assure a profit or protect against a loss.
A basis point is one hundredth of 1 percentage point. Debasement refers to lowering the value of a currency.
Copyright © 2026 Harbor Capital Advisors, Inc. All rights reserved.