 Contact
A Dynamic Picture is Worth 1,000 Words! HGER: Harbor Commodity All-Weather Strategy ETF
November 16, 2023


Below, you will find two charts: one depicts an index that has been in existence for several decades, while the other illustrates a recently developed dynamic index. As the saying alludes to, a picture can convey more meaning that a thousand words!
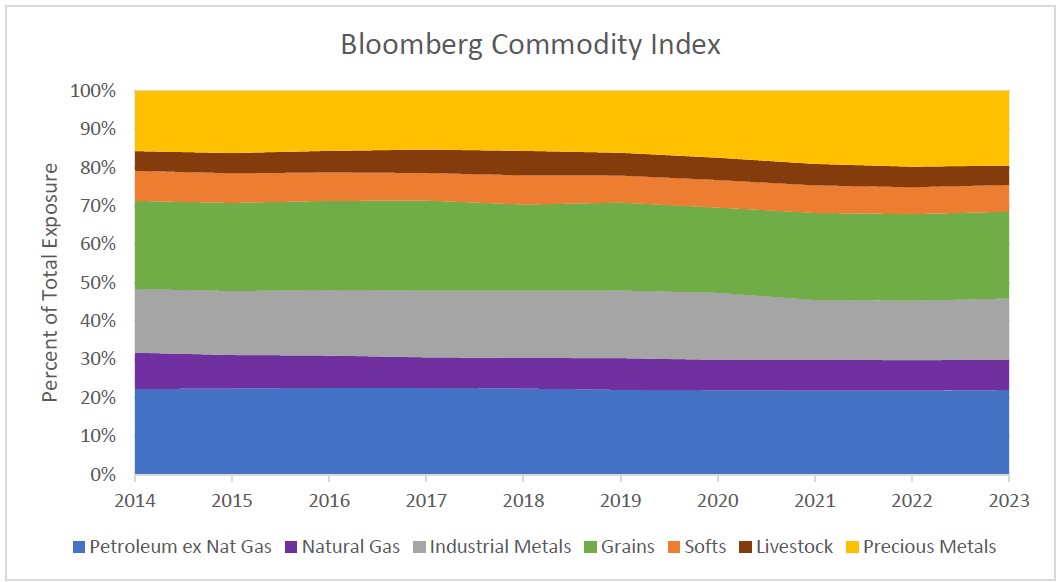
Source: Bloomberg, October 2023
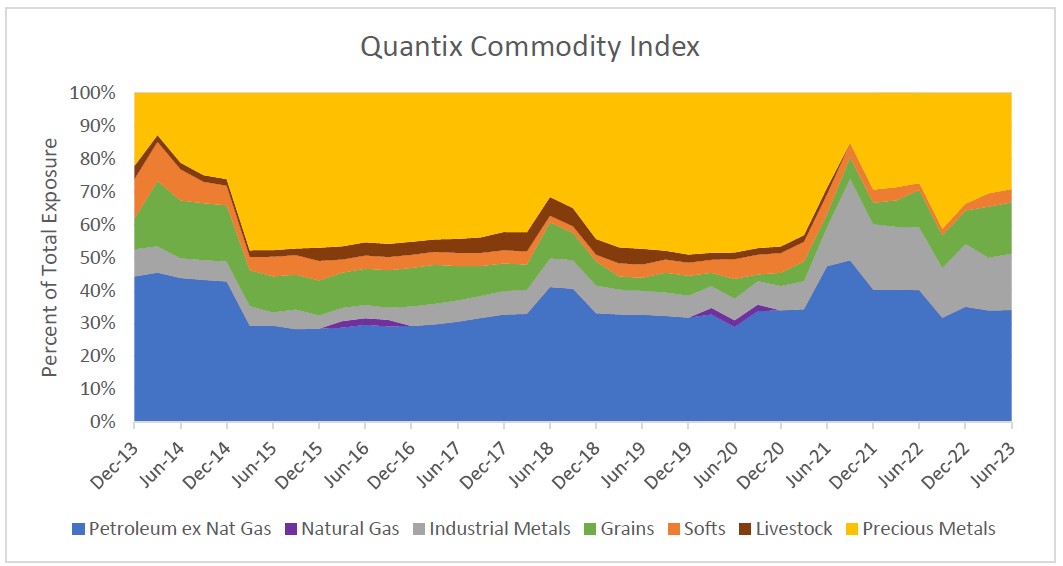
Source: Quantix. The Index Launch Date is 14-Jan-21. All information for an index prior to its Launch Date is hypothetical back-tested, not actual performance, based on the index methodology in effect on the Launch Date.
- The Bloomberg Commodity Index (BCOM) was launched in 1998 (then called the Dow Jones-AIG Commodity Index) and remains one of the most widely recognized commodity benchmarks. Presently, many of the available commodities investment products in the market exhibit a strong correlation to BCOM. To illustrate, out of the 56 diverse offerings, including mutual funds and ETFS, classified within Morningstar's Commodities Broad Basket Category, the 15 largest strategies by AUM collectively managing $36 billion in assets (representing 78% of the category assets) exhibit an average 3-year correlation of 0.95 to BCOM. (Source: Morningstar Direct, October 2023)
- There are multiple distinct differences between BCOM and the Quantix Commodity Total Return Index that investors should be aware of. For starters, the BCOM index is production and liquidity weighted. The index is rebalanced annually based on the previous year’s production of global commodities and liquidity. Liquidity is included to account for commodities that are not produced in large quantities each year. For example, gold exposure based on production alone would be mere 1.6% as opposed to the adjusted exposure of nearly 15%. (Source: Bloomberg, October 2023)
- Another difference between the two Indices is rebalance frequency. BCOM rebalances only once a year, which may hinder investors' ability to potentially take advantage of commodity price fluctuations throughout the year. For instance, consider the scenario where energy prices suddenly surge in early 2022 due to the Ukrainian War or when gold prices surge due to Federal Reserve (Fed) actions.
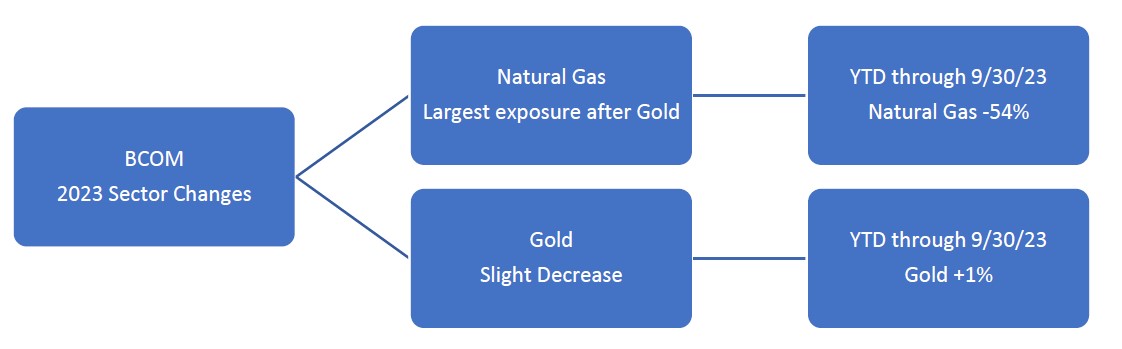
- Another difference stems from the construction of the index, which relies on production/liquidity. To illustrate this point, let's consider the case of Natural Gas. Despite experiencing a negative return of -37% in 2019 and -42% in 2020 (Source: Morningstar Direct, October 2023) within BCOM, passive mutual funds and ETFs that seek to track the index would still be required to increase their exposure every year to align with BCOM's weightings. This could present a challenge for investors relying on these funds as they are compelled to follow the index without considering the poor performance of Natural Gas. Another timely example is BCOM’s target weights for 2023, see below.
Performance data shown represents past performance and is no guarantee of future results.
- Not all commodities are equal. For instance, individuals with gasoline powered cars know the price of gas at the pump is highly correlated to the price of oil. However, the prices of candy bars do not seem to be significantly influenced by the price of sugar, nor do t-shirts appear to be greatly impacted by the price of cotton. Consequently, if advisors desire a hedge against inflation, opting for an index that assigns weights to commodities based on their production rather than their sensitivity to inflation may not provide the desired results.
- The subsequent factor to consider is the roll yield associated with commodities, which can be thought of as the expenses incurred in storing them. However, it is essential to note that these costs are not the same for all commodities. For instance, sugar can be stored in a simple warehouse. On the other hand, natural gas requires storage underground, usually under high pressure or in a converted liquid form, both of which are costly. It is worth mentioning that roll yields can vary in their direction, either positive or negative, and can also change over time. Furthermore, each commodity has its own distinct roll yield. It is intuitive that investors seek to have higher exposure to commodities with a positive roll yield return while aiming for lower exposure (or avoiding exposure altogether) to commodities with a negative roll yield return.
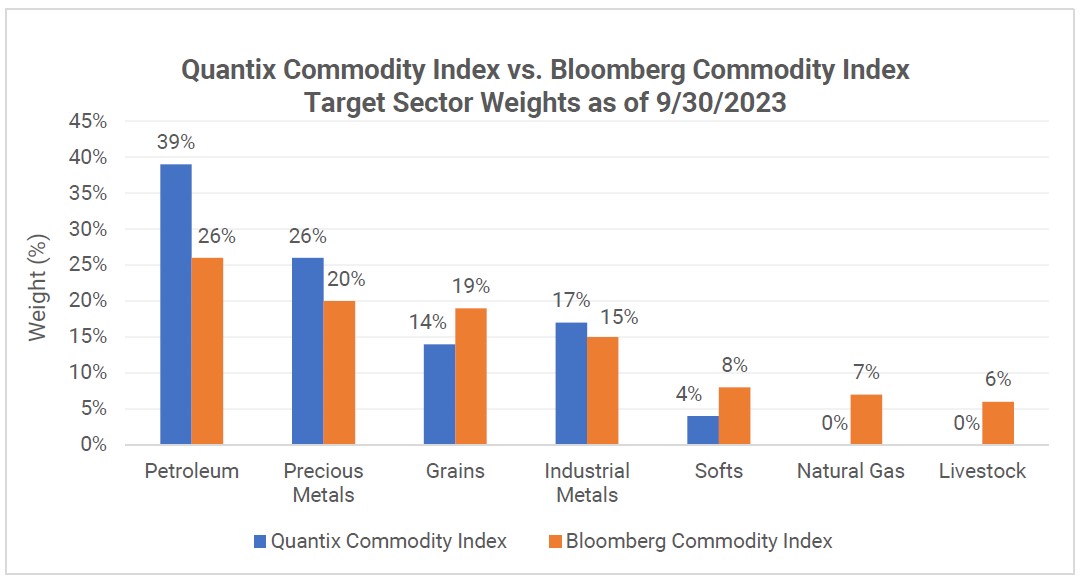
Source: Bloomberg and Quantix, October 2023.
- Finally, many investors treat commodities as a tactical asset class. They desire to have exposure to commodities such as energy when there is a high level of inflation, and perhaps gold when there is disinflation. However, accurately predicting markets can be quite challenging.
HGER, which seeks to track the Quantix Commodity Total Return Index, is a dynamic solution for investors, addressing ALL the aforementioned differences in a cost-effective ETF wrapper. The Quantix Team has developed a dynamic index that undergoes 1) quarterly rebalancing to help account the lag effect, 2) enhancing exposure to commodities that are highly responsive to inflation and offer positive roll yield returns while simultaneously reducing the allocation to commodities with weak correlation to CPI and negative roll yield returns. Finally, 3) HGER can allocate up to 40% in gold based on market signals, surpassing the 15% limit imposed on BCOM. See below:
During HGER’s 3Q 2022 rebalance, Gold exposure was increased to 39%.
From 10/1/22 – 9/30/23 Gold returned +11% vs. -71% for Natural Gas.
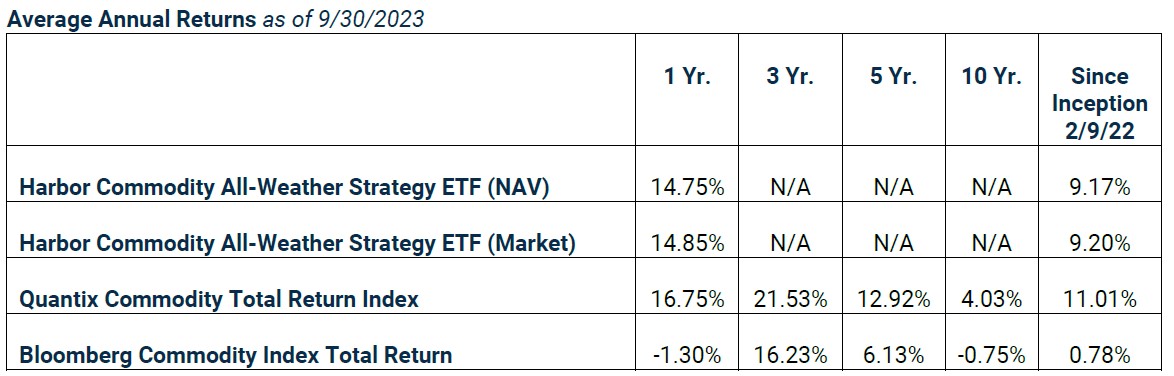
BCOM during this period returned -1.3% while HGER returned +14.8%.
In summary, HGER can serve as a strategic investment, offering increased sensitivity to inflation during periods of rising inflation, and higher exposure to gold during disinflationary periods.
Performance data shown represents past performance and is no guarantee of future results. Past performance is net of management fees and expenses and reflects reinvested dividends and distributions. Past performance reflects the beneficial effect of any expense waivers or reimbursements, without which returns would have been lower. Investment returns and principal value will fluctuate and when redeemed may be worth more or less than their original cost. Returns for periods less than one year are not annualized. Current performance may be higher or lower and is available through the most recent month end at harborcapital.com or by calling 800-422-1050.
The performance data presented with respect to the Quantix Commodity Total Return Index (“QCI”) (the “Index”) prior to 02/09/2022, represent pre-inception index performance data (“PIP data”) to illustrate how the Index may have performed had it been in existence prior to 02/09/2022. PIP data is based on a criteria applied retroactively with the benefit of hindsight and knowledge of factors that may have positively affected its performance and cannot account for all financial risk that may affect the actual performance of the Harbor Commodity All-Weather Strategy ETF (the “ETF”), which seeks to track the Index. The ETF is new 02/09/2022 and any performance prior to the inception of the Index is hypothetical. PIP data may differ from actual performance of the ETF due to Index tracking error and other reasons; and it does not reflect the potential deviation between the market price and the net asset value of ETF shares. While an investor cannot invest directly in the Index, for purposes of showing the PIP data herein, all PIP information represents the Index information net of the 0.68% expense ratio of the ETF. Call 800-422-1050 for a full description of the Index’s methodology.
Important Information
For Institutional Use Only – Not For Distribution to the Public.
There is no guarantee that the investment objective of the Fund will be achieved. Stock markets are volatile and equity values can decline significantly in response to adverse issuer, political, regulatory, market and economic conditions. A non-diversified Fund may invest a greater percentage of its assets in securities of a single issuer, and/or invest in a relatively small number of issuers, it is more susceptible to risks associated with a single economic, political or regulatory occurrence than a more diversified portfolio.
Commodity Risk: The Fund has exposure to commodities through its and/or the Subsidiary’s investments in commodity-linked derivative instruments. Authorized Participant Concentration/Trading Risk: Only authorized participants (“APs”) may engage in creation or redemption transactions directly with the Fund. Commodity-Linked Derivatives Risk: The Fund’s investments in commodity-linked derivative instruments (either directly or through the Subsidiary) and the tracking of an Index comprised of commodity futures may subject the Fund to significantly greater volatility than investments in traditional securities.
The views expressed herein are those of Harbor Capital's investment professionals at the time the comments were made. These views are subject to change at any time based upon market or other conditions, and the author/s disclaims any responsibility to update such views. These views may not be relied upon as investment advice and, because investment decisions are based on many factors, may not be relied upon as an indication of trading intent. The discussion herein is general in nature and is provided for informational purposes only. There is no guarantee as to its accuracy or completeness. Past performance is no guarantee of future results.
Investment comparisons are provided for illustrative purposes only. To better understand the similarities and differences between investments, including investment objectives, risks, taxes, redemptions, fees and expenses, it is important to read the products' prospectuses.
The Bloomberg Commodity Index (“BCOM”) is designed to be a highly liquid and diversified benchmark for commodity investments via futures contracts.
The Quantix Commodity Total Return Index (“QCI”) is calculated on a total return basis, which combines the returns of the futures contracts with the returns on cash collateral invested in 13-week U.S. Treasury Bills. This unmanaged index does not reflect fees and expenses and is not available for direct investment. The Quantix Commodity Total Return Index was developed by Quantix Commodities LP and is owned by Quantix Commodities Indices LLC. These indices are unmanaged and do not reflect fees and expenses and are not available for direct investment.
The weightings, holdings, industries, sectors, and countries mentioned may change at any time and may not represent current or future investments.
Quantix Commodities LP (“Quantix”) is a third-party subadvisor to the Harbor Commodity All-Weather Strategy ETF.
3196041


