 Contact
Quantix Q4 2023 Newsletter
February 05, 2024


Happy New Year! This common annual greeting is full of optimism for the upcoming twelve months. At the start of 2024, there is certainly more optimism in financial markets than twelve months ago when forecasters1 shared a near consensus view that inflation-fighting rate hikes would lead to a recession.
Instead, the US Federal Reserve (“the Fed”) appears to have achieved the “softlanding” nirvana of cooling inflation without sacrificing economic growth, at least in the short-term. This remarkable outcome has largely dispelled those forecasts for weak equity markets, interest rate cuts, and volatile commodity markets. By the end of 2023, global equity markets were at or near record highs, interest rates remain at cyclical highs, and the daily volatility of commodity markets reached the lowest levels in over five years2.
While the consensus view for financial markets in 2024 isn’t quite as universal, most forecasters are calling for stable and rising equity markets with lower volatility across all asset classes. Given the recent track-record of these prognosticators, we believe wise investors should be skeptical of these forecasts, which has implications for broad portfolio construction. As recently evidenced post the COVID pandemic, markets can often surprise, historical correlations can break down, and truly diversified portfolios are those that are prepared for the unexpected.
Long-Term Diversification Properties For Commodities
In previous letters, I have discussed a bull case for commodities with potential returns as the primary purpose for an allocation to the asset class. Given the market environment that may persist for the foreseeable future, perhaps an even more compelling reason is the diversification benefits that a commodity allocation can provide, particularly to potentially protect against unexpected outcomes.
Quantix has recently completed a study that underscores the benefits of commodities as a portfolio diversifier. The study shows that over longer periods of financial market history (since the early 1900s), equity and fixed income markets are on average positively correlated, and it was only in the recent era of extremely low rates and low inflation that they exhibited negative correlation. With inflation (and interest rates) returning to historical norms, the recent period since 2000 may prove the historical anomaly rather than the new normal, and we believe that diversification is better achieved by the inclusion of a commodities allocation.
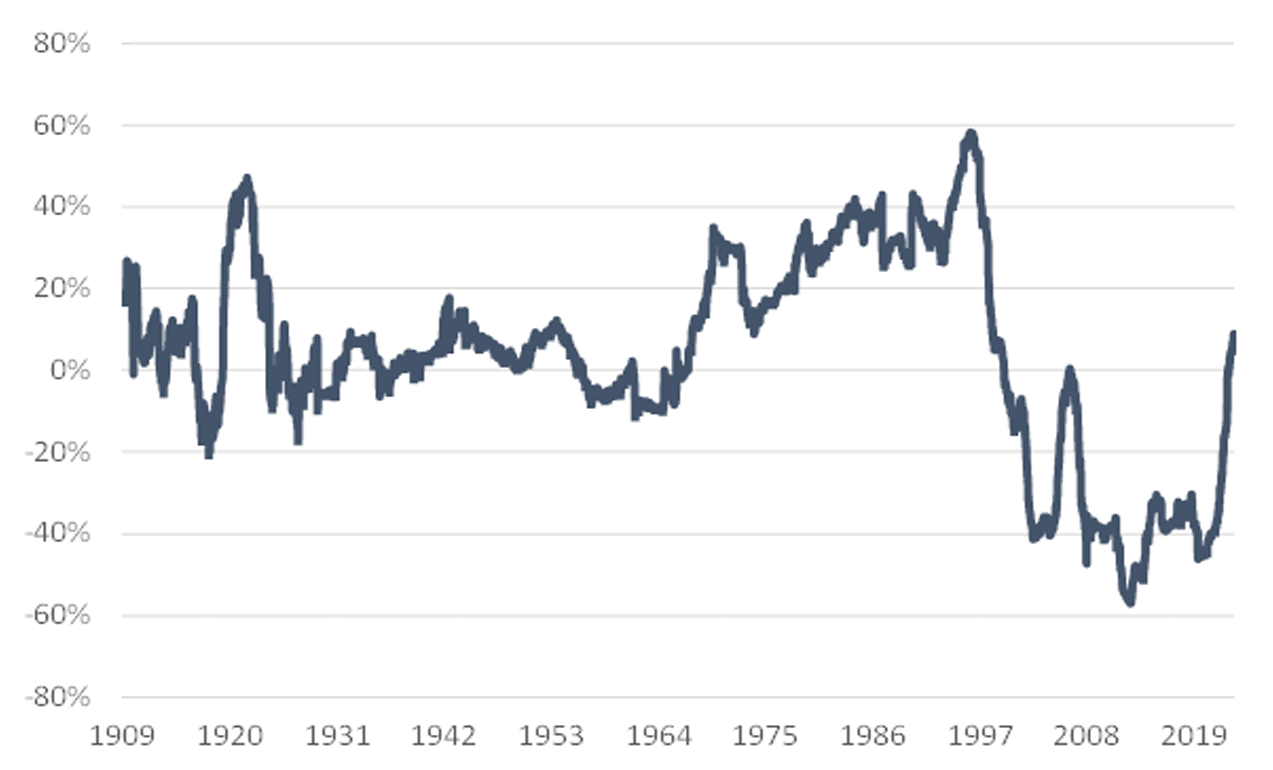
Performance data shown represents past performance and is no guarantee of future results.
Furthermore, portfolio diversification is also critical in the event of idiosyncratic black swan events, in our view. We believe that exposure to commodities such as Gold and Oil can provide geopolitical protection in a world that is unfortunately ever more hostile.
Our Outlook For Key Commodity Sectors
Our overarching premise is that commodity returns are more likely to be driven by debasement than scarcity in 2024. The macroeconomic signals within the Quantix Commodity Total Return Index, underlying benchmark for Harbor Commodity All-Weather Strategy ETF (HGER), moved the Gold weight to its maximum level, with a commensurate reduction in the consumable commodities, as part of the most recent rebalance that took place in January 2024.
Below, I give some greater detail to the themes that we believe are most relevant to each sector in the coming months.
Petroleum
Leading agencies in the sector, such as the International Energy Agency, Energy Information Agency, and Organization of Petroleum Exporting Countries (OPEC), have more significantly diverging forecasts for the supply/demand balance for 2024 than I can recall. This huge dispersion in forecasts could lead to unexpected volatility, depending on which scenario plays out.
The table below identifies the variables that drive the dispersion in forecasts according to Citigroup. The 5.4 million-barrel-per-day swing in balances between the upper left corner and lower right corner has enormous implications on oil prices.
| 2025 oil balance scenarios | Sustained major supply disruption, OPEC+ deepens supply cuts | Sustained major supply disruption, OPEC+ adds supply | OPEC+ holds cuts through end-2025 | Base case OPEC+ holds cuts through 1H'25 | OPEC+ ends cuts, returns supply partially / gradually | OPEC+ ends cuts, returns all supply |
|---|---|---|---|---|---|---|
| Bull case demand +1.5 | -1.1 | -0.6 | -0.1 | 0.4 | 1.9 | 3.1 |
| Bull case demand +0.7 | -0.3 | 0.2 | 0.7 | 1.2 | 2.7 | 3.9 |
| Bull case demand +0.3 | 0.1 | 0.6 | 1.1 | 1.6 | 3.1 | 4.3 |
Quantix believes that current scarcity delivered by OPEC+ cuts is somewhat artificial and, until it is resolved, the build-up in spare capacity will prevent large, speculative-driven price spikes in Oil.
Natural Gas
The recent cold wave in the US has sparked a significant rally in US Natural Gas prices, but it is largely confined to spot contracts.
The first nearby Natural Gas contract (on the chart below) has rallied over 75 cents since the start of the year, while forward prices have had a much more muted response due to oversupply concerns. The bottom panel on the chart shows the change in each contract.
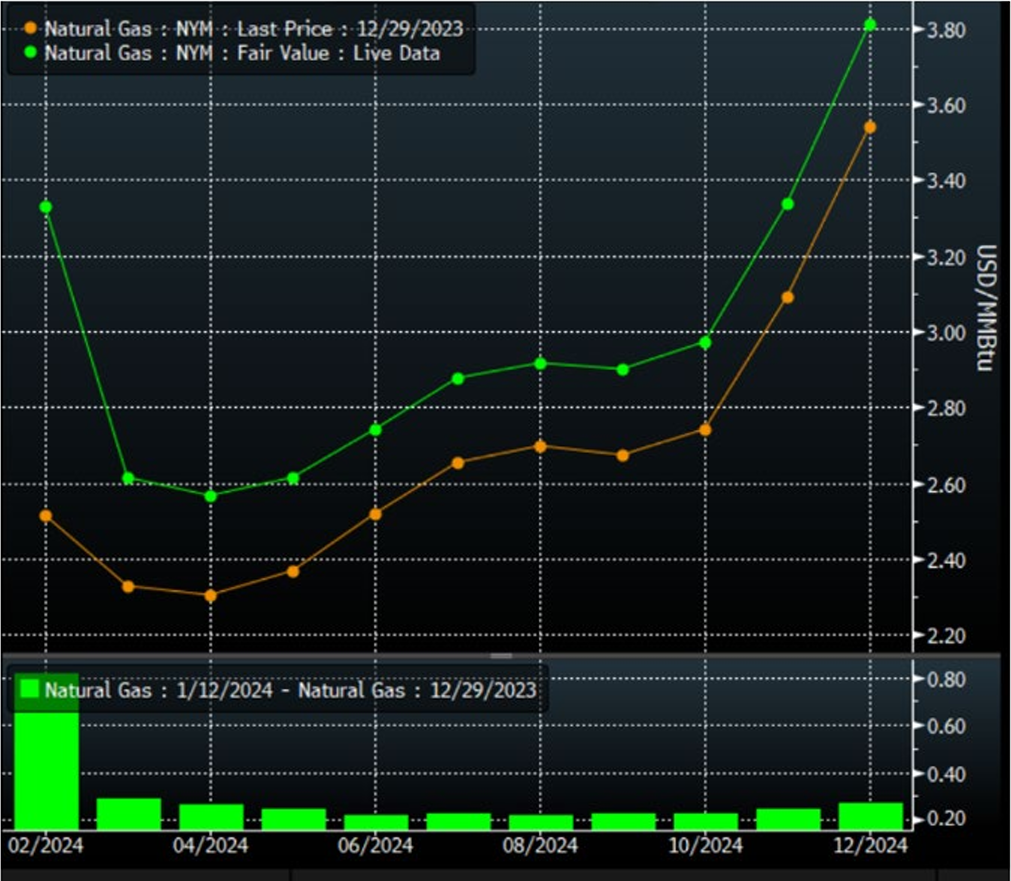
The overall fundamental picture remains one of oversupply until greater Liquified Natural Gas (LNG) off-take is possible. Quantix believes that prices will need to dip low enough in 2024 to force production cuts. The effect of these cuts could ultimately lead to the next bull cycle in Natural Gas, if they remain in place while additional LNG facilities are brought online in 2025.
Grains
The recent USDA report was incredibly bearish for Grains prices. US Corn production in 2023 was reported at a record 15.342 billion bushels vs. 13.73 billion bushels in 2022. Soybean and Wheat data also exceeded pre-report forecasts. Quantix also has a less favorable view of the sector’s ability to drive returns in 2024, relative to other sectors.
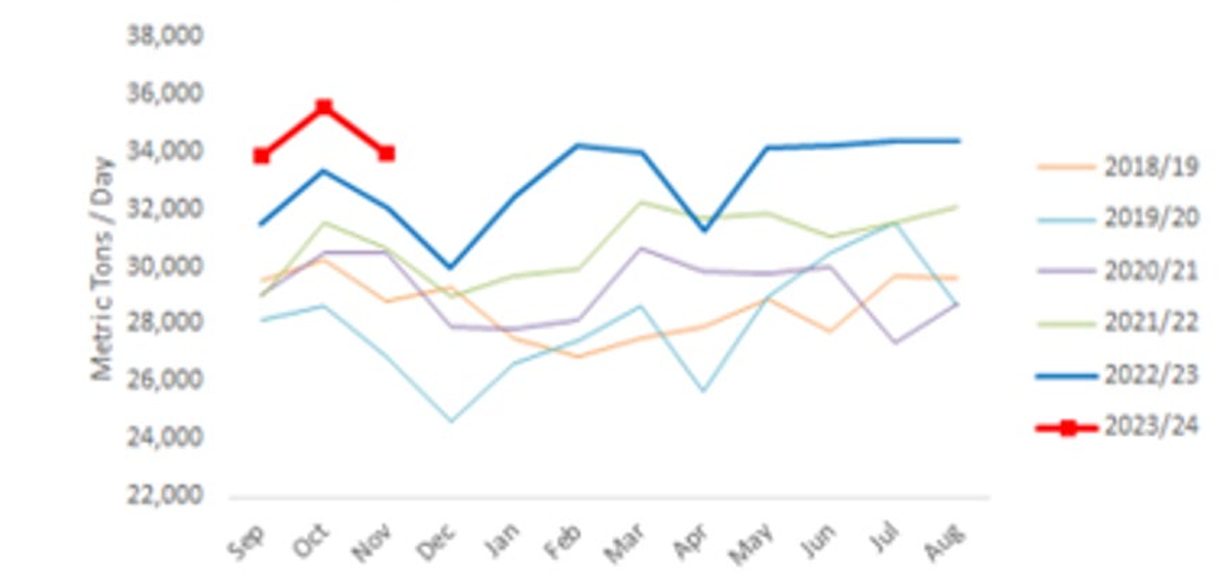
However, one bright spot may be Soybean Oil where the demand for biofuels continues to drive impressive Soybean Oil demand growth (see chart below) and continues to create a structural shortage. While Soybean crops are ample, crushers will struggle to keep up with Soybean Oil demand.
Livestock/Softs
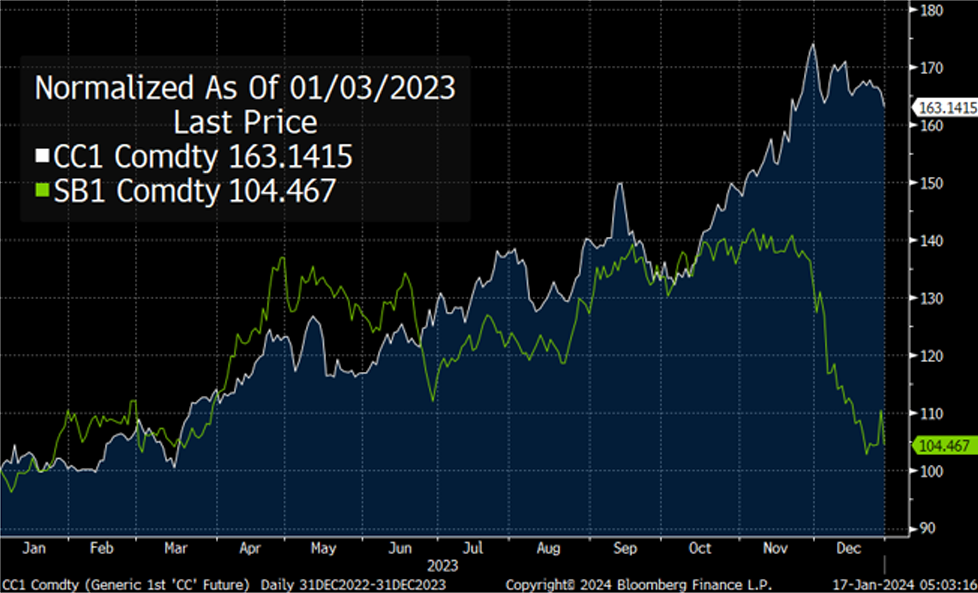
The Soft commodities were the best performing sector in 2023, with the BCOM Softs Index up nearly 13%. There were valid justifications for the price appreciation at the time as strong fundamentals drove significant gains.
However, Quantix believes that the current one-sided positioning will make it difficult to sustain these price levels in 2024. As seen in the chart below, Sugar (in green) suffered a significant pullback in December 2023 and Cocoa (in white) could be next. Once conviction changes in these smaller markets, there is simply no one left to sell to.
Precious Metals
We believe that the setup for Gold is very positive. In spite of the strong headwinds of rapidly rising real rates, Gold was up 13% in 2023, reaching a record high3 at $2,135/oz. This was partly due to continued Central Bank buying at record levels; in the nine months through September 2023, net purchases stood at 800 tons. This was 14% higher than the same period in 2022, which ended with the highest level of annual demand on record back to 1950.
Looking ahead to 2024, a combination of stable or lower real rates, the current widespread geopolitical unrest, relatively light retail (ETF) and speculative positioning, and continued Central Bank demand are likely to create tailwinds.
Industrial Metals
Quantix believes we are more likely to see true scarcity in this sector than any other due to lack of supply and robust demand in certain commodities. A weakening dollar and stable or lower interest rates should also help restocking demand from (in some cases historically) low inventory levels.
Within the sector, we are most bullish about Copper for idiosyncratic reasons. These general demand elements are supplemented with strong Energy Transition demand in addition to supply concerns related to significant mine closures.
Emissions
2023 was an example of the convergence in emission credit prices driven by differing phases of regulatory focus and discipline in different regions. California Carbon Allowances in the US continued to rise (white line in chart below), up 30% on the year, while European credit prices (EUAs in orange and UKAs in blue) declined, down -21% and -52% respectively.
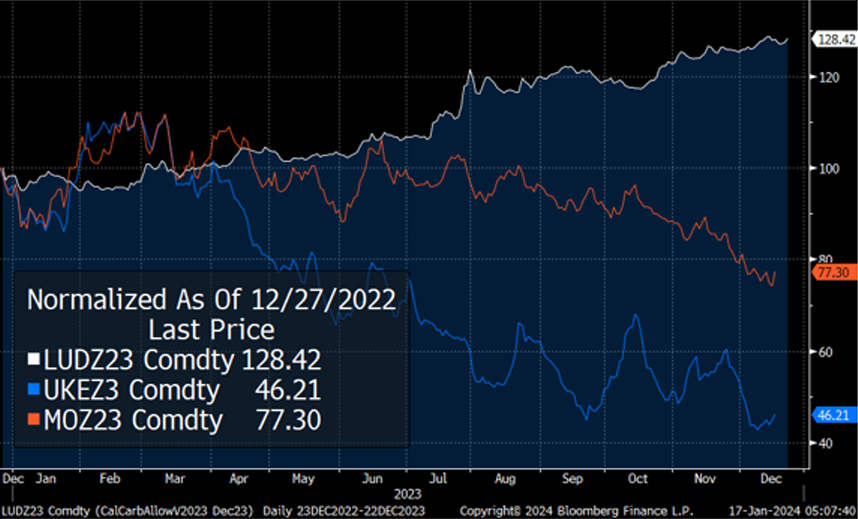
While there are some minor differences in policy scope, European credits still trade at a premium to US credits. Quantix believes there is room for continued convergence and anticipates that this trend continues in 2024.
Conclusion
The past year was another poignant reminder that investors should plan for the unexpected. Financial forecasts are often far from reality and the best portfolio defense can be achieved through diversification. Increased equity and bond correlations suggests that commodity strategies are an attractive place to find uncorrelated returns.
1 Reuters, “Fed, economists make course correction on US recession predictions”, August 2023.
2 Source: Quantix Commodities. Rolling 20-day volatility of BCOM Index.
3 Source: Financial Times, “Gold price hits all-time high as traders bet on interest rate cuts”, 06-Dec-23
Important Information
Investors should carefully consider the investment objectives, risks, charges, and expenses of a Harbor fund before investing. To obtain a summary prospectus or prospectus for this and other information, visit www.harborcapital.com or call 800-422-1050. Read it carefully before investing.
All investments involve risk including the possible loss of principal.
The views expressed herein may not be reflective of current opinions, are subject to change without prior notice, and should not be considered investment advice.
RENW: The Fund is non-diversified and may invest a greater concentrate of its assets in a particular sector of the commodities market (such as metal, gas or emissions products). As a result, the Fund may be more susceptible to risks associated with those sectors. Energy Transition Risk: The commodities included in the Index may become less representative of energy transition trends over time and the Fund’s investments may be significantly impacted by government and corporate policies. Foreign Currency Risk: Because the Index may include futures contracts denominated in foreign currencies, the Fund could be subject to currency risk.
HGER: There is no guarantee that the investment objective of the Fund will be achieved. Stock markets are volatile and equity values can decline significantly in response to adverse issuer, political, regulatory, market and economic conditions. A non-diversified Fund may invest a greater percentage of its assets in securities of a single issuer, and/or invest in a relatively small number of issuers, it is more susceptible to risks associated with a single economic, political or regulatory occurrence than a more diversified portfolio.
Commodity Risk: The Fund has exposure to commodities through its and/or the Subsidiary’s investments in commodity-linked derivative instruments. Authorized Participant Concentration/Trading Risk: Only authorized participants (“APs”) may engage in creation or redemption transactions directly with the Fund. Commodity-Linked Derivatives Risk: The Fund’s investments in commodity-linked derivative instruments (either directly or through the Subsidiary) and the tracking of an Index comprised of commodity futures may subject the Fund to significantly greater volatility than investments in traditional securities.
Investing entails risks and there can be no assurance that any investment will achieve profits or avoid incurring losses.
The Bloomberg Commodity Index (BCOM) measures the performance of future contracts on physical commodities which traded on US exchanges and London Metal Exchange. The commodity weightings are based on production and liquidity, subject to weighting restrictions applied annually. This unmanaged index does not reflect fees and expenses and is not available for direct investment.
BCOM Softs Index is a commodity group subindex of the Bloomberg Commodity Index (BCOM). It is composed of futures contracts on coffee, cotton and sugar. It reflects the return of underlying commodity futures price movements only and is quoted in USD.
The S&P 500 Index is an unmanaged index generally representative of the U.S. market for large capitalization equities. This unmanaged index does not reflect fees and expenses and is not available for direct investment.
The Quantix Commodity Total Return Index is calculated on a total return basis, which combines the returns of the futures contracts with the returns on cash collateral invested in 13-week U.S. Treasury Bills. This unmanaged index does not reflect fees and expenses and is not available for direct investment. The Quantix Commodity Index was developed by Quantix Commodities LP and is owned by Quantix Commodities Indices LLC.
Indices listed are unmanaged, and unless otherwise noted, do not reflect fees and expenses and are not available for direct investment.
Quantix Commodities LP is the subadvisor for the Harbor Commodity All-Weather Strategy ETF and the Harbor Energy Transition Strategy ETF.
Foreside Fund Services, LLC is the Distributor of the Harbor ETFs
3372891


