 Contact
Mapping the Business Cycle Q1 2024
Harbor Multi-Asset Solutions
January 17, 2024


A Note From the Authors
We have long held the view that one of the most powerful approaches to investing incorporates both quantitative and qualitative elements. Quantitative investment approaches help to anchor an investment process to dispassionate views that are immutable to behavioral bias. Qualitative investment approaches help to discover nuance and identify complex relationships that may differ from what has occurred historically.
As a result, we have enhanced our investment approach to incorporate a systematic starting point that complements our qualitative analysis. We believe that dynamics related to Growth, Liquidity and Inflation (“GLI”) drive the business cycle. We also believe that market sentiment (psychology of market participants) is an important driver of asset returns in the short run. Thus, by using quantitative techniques to measure and map these two return drivers (business cycle + sentiment), we are likely able to identify the optimal asset allocation starting point for our portfolios. We seek to glide our asset allocation according to where we are in our proprietary “Business Cycle Regime” rather than anchoring to the 60/40 neutral point our industry tends to rely upon.
As a result of our enhanced investment approach, our Asset Allocation Viewpoints presentation has evolved and now reflects our emphasis on the Business Cycle Regime starting point.
Our flagship publication is now titled “Mapping the Business Cycle” and will hopefully provide differentiated insights for you.
Thank you,
Spenser Lerner, Head of Multi-Asset Solutions
Jake Schurmeier, Head of Fixed Income and Currencies
Mapping the Business Cycle
Actionable investment conclusions from Harbor’s Multi-Asset Solutions TeamMacro Landscape: Q1 2024
Throwing caution to the wind
- U.S. economic growth returned to normal in Q4 after the bumper growth in Q3. Considering the steep climb in interest rates over the preceding 2 years, normal growth remains a remarkable feat.
- Both sequential and most trimmed measures of inflation are near the FOMC’s 2 percent target as commodity, goods, and services prices are all contributing to disinflation. After adding it all up at their December meeting, Chair Powell signaled that the next move for the Fed is more likely a cut than an additional rate increase.
- The predicted rate cut turned the tide on investor sentiment. For markets, the exasperating wait for a recession is seemingly over as we skip the contraction and head straight into a recovery. The gap between market pricing and early cycle conditions remains wide, offering material upside if the Fed's pivot comes soon enough.
- Last year, there were the few haves and the many have nots in equity markets. Until the Fed’s late pivot, tech behemoths, Glucagon-like peptide-1 (GLP1) beneficiaries, and artificial intelligence companies accounted for the bulk of index returns. With receding recession risk, lofty valuations for the largest firms, and expected interest rate cuts, we believe areas such as small-cap, foreign, and cyclical sectors like energy and financials are poised to benefit from a soft landing.
- With central banks hopefully exiting center stage, simmering geopolitical tensions are an unfortunate remnant of 2023 and will likely collide with elections in many regions in 2024. Will this be the year that it no longer pays to look through geopolitical shocks? If so, gold offers an attractive hedge for balanced portfolios.
For Institutional Use Only. Not for Distribution to the Public.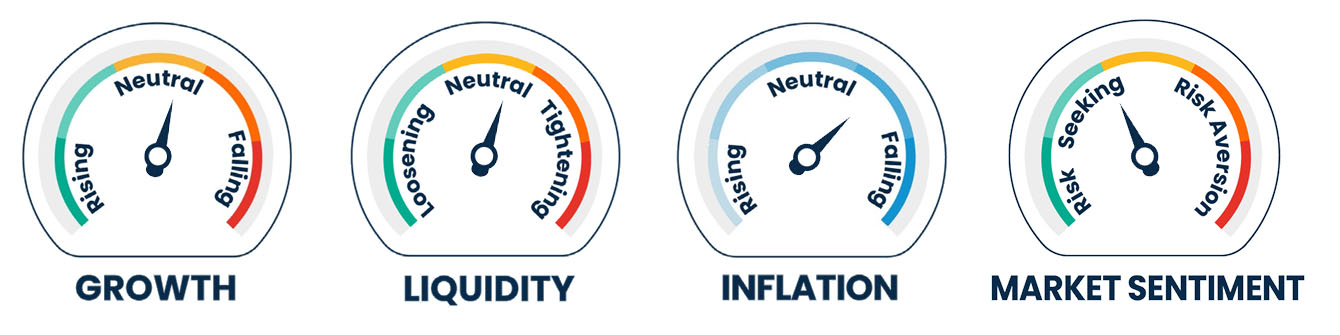
Tactical Asset Allocation & Market Themes
| Underweight | Neutral | Overweight | |||||
|---|---|---|---|---|---|---|---|
| | | |||||||
| Unconstrained vs. 60/40 | Chg | Rationale | |||||
| Portfolio Risk (Beta, Relative Vol) | ↑ | • | Moderate overweight on resilient economy, increasing odds of a soft landing and risk seeking sentiment | ||||
| Portfolio Duration | • | Duration approaching neutral as Fed pivot reduces upside risks materially | |||||
| Equities (ACWI) | ↑ | • | Late cycle regime with positive market sentiment is typically afavorable environment for equities | ||||
| U.S. Large Cap | • | Higher margins and FCF for US large cap is more attractive in a late cycle environment | |||||
| US SMID Cap | • | Valuations appear attractive but maintain neutral due to higher levels of debt and interest costs | |||||
| Western Europe | ↑ | • | Falling inflation and valuations are favorable; exposure to global manufacturing cycle downturn is a headwind | ||||
| Japan | • | Attractive valuation, improving corporate governance a tailwind, policy remains favorable | |||||
| Emerging Markets | • | Valuations appear attractive, economic momentum is mixed, property headwinds in China are severe | |||||
| Equity Styles1 | |||||||
| Value | • | Selectively leaning into attractive value sectors, but overall value spreads are a headwind to the style | |||||
| Growth | • | Beneficiary of peak rates & inflation; fundamentals improving with positive EPS revisions; prefer quality growth | |||||
| Quality | • | Favor companies that maintain pricing power and generate high levels of FCF | |||||
| Low Vol | • | We believe it is still too early to lean into defensives given the broader resilience of the economy | |||||
| Fixed Income (Barc Agg) | • | Fixed income offers attractive real yields; duration is moving closer to neutral within fixed income | |||||
| Treasury | • | Treasury underweight reflects better opportunities in IG and MBS for quality exposure | |||||
| IG | • | While rich to MBS, IG credit risk more conservatively priced than HY or equity markets | |||||
| MBS | • | MBS has continued to offer significant relative value as economy slows and rate vol. normalizes | |||||
| Credit (Non Agg) | • | Credit priced to a soft landing, but it is still the place for income generation | |||||
| HY BONDS | • | HY offers low risk premia, however, carry is an attractive factor in a benign macro environment | |||||
| EMD | • | EM debt should diversify given divergent policy paths, albeit without significant yield pickup | |||||
| Loans | • | Similar to HY, implied default rates in the loan market are quite low, but carry remains attractive | |||||
| Currency (USD) | • | Recent dollar weakness is more a valuation story than a change in the U.S. economy's relative strength | |||||
| Vs. Developed | • | Signs of economic weakness abroad will likely slow dollar's normalization | |||||
| Vs. Emerging | • | Proactive policy supports currencies, however, macro slowdown will likely weigh on EM | |||||
| Commodities | • | Gold could offer diversification benefits; we expect supply deficits in 2H 2024 for energy | |||||
| Precious Metals | ↓ | • | Gold offers diversification but we expect duration to increasingly diversify equities again in 2024 | ||||
| Ind Metals, Agg, Energy | • | Energy transition requires investment; energy supplies potentially in deficit; potential hedge to conflict | |||||
| Cash (T-Bills) | ↓ | • | Cash offers an attractive yield but we expect duration to become negatively correlated with equities again | ||||
1Overall "equity styles" cannot be o/w or u/w, only individual equity styles
For hypothetical illustrative purposes only. This information should not be considered as a recommendation to purchase or sell a particular security
Source: Harbor MAST; Positioning as of December 2023
Business Cycle: Growth Conditions (G)
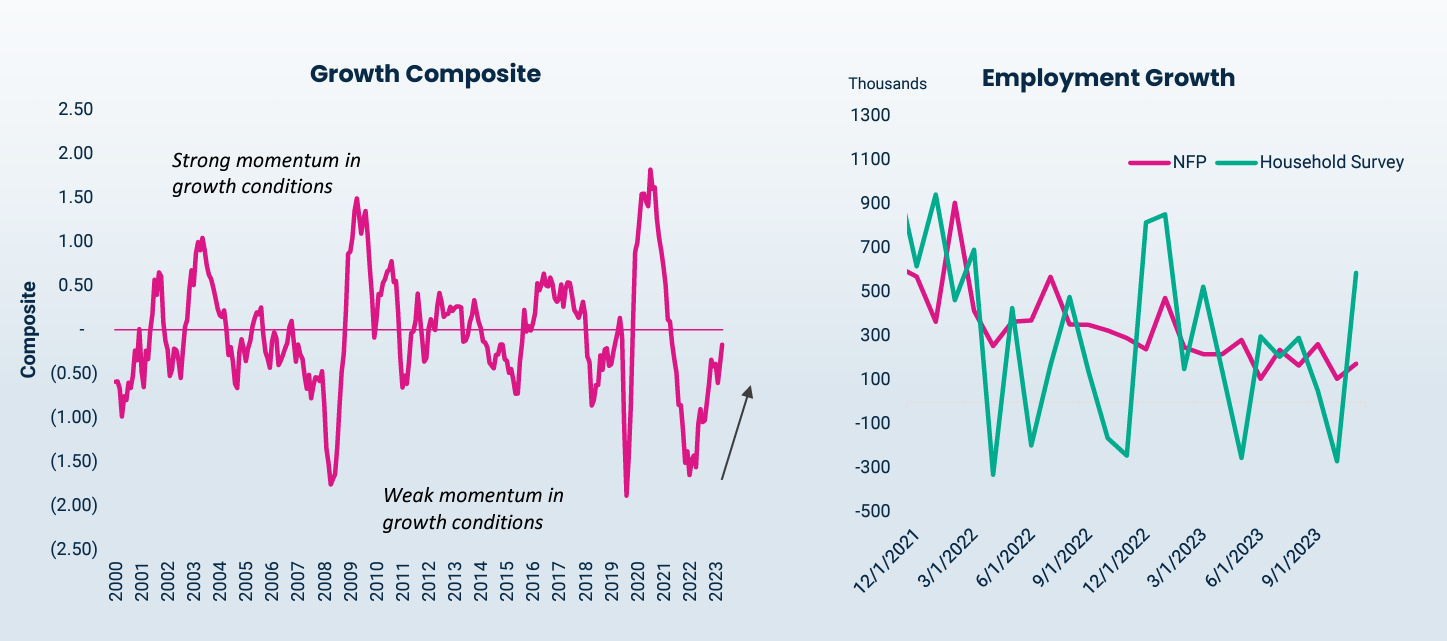
- Economic growth slowed in the 4th quarter as robust Q3 growth was unsustainable. We are tempted to say that growth is closer to potential, 2 percent or so, but the resilience of the labor market and recent productivity estimates suggest potential growth may be meaningfully above recent trend growth.
- Our current business cycle regime remains in a “Late-Cycle” environment alongside risk seeking behavior. The manufacturing recession continues, while the services sector preserves the expansion.
- Lower interest rates stemming from the Fed’s pivot should support capital-intensive sectors like housing and manufacturing that have struggled since the start of the hiking cycle. Meanwhile, labor market conditions are easing, but not enough to suggest a material increase in unemployment.
For more information about Harbor's indicators and models, please see the end of this document. For hypothetical and illustrative purposes only. This information should not be considered as a recommendation to purchase or sell a particular security.
Sources: Harbor MAST, Bloomberg L.P.; Data as of December 2023
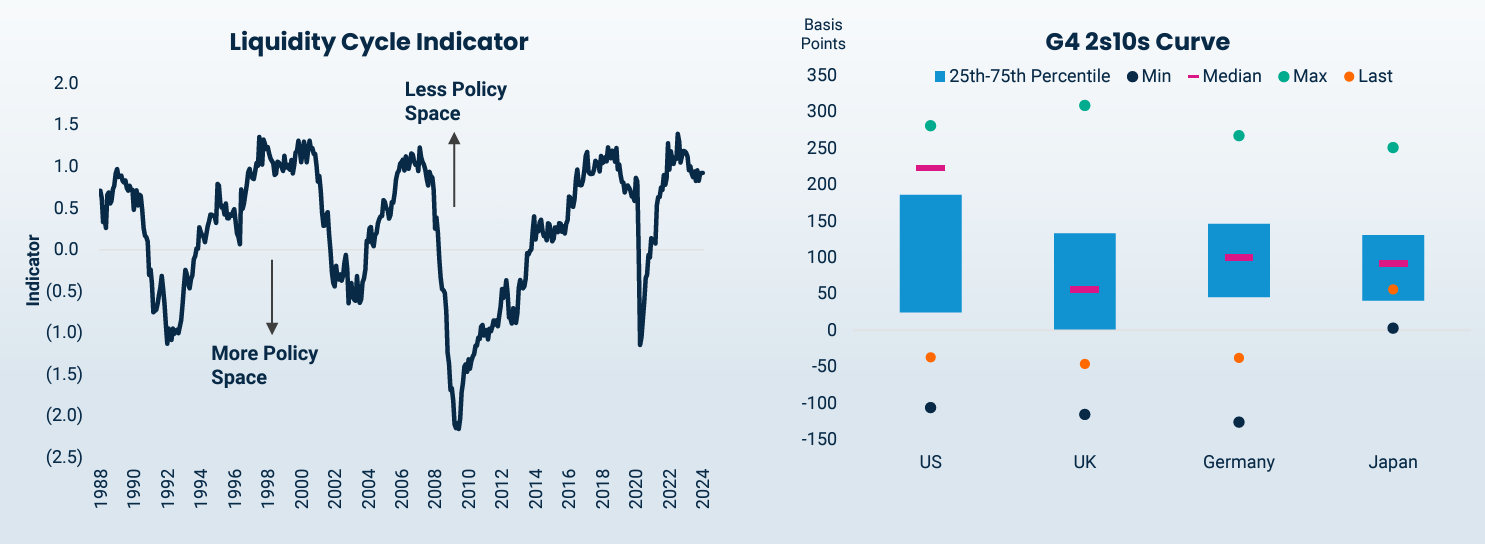
- We believe credit growth should rebound after the substantial easing in financial conditions that followed the Fed’s pivot.
- However, quantitative tightening is likely to meet binding constraints in 2024.
- Recent financial market liquidity shocks like the UK’s LDI funds, March 2020, and September 2019 in U.S. repo markets are reminders of the non-linear dynamics of liquidity.
- Constraints vary across jurisdictions, whether it’s the Eurozone’s fragmented banking sector or high-quality liquid assets demand in the U.K. and U.S.
- Steeper curves have the potential to benefit banks, but the extent depends on the competition for liquidity.
For more information about Harbor's indicators and models, please see the end of this document. For hypothetical and Illustrative purposes only.This information should not be considered as a recommendation to purchase or sell a particular security.
Sources: Harbor MAST, Bloomberg L.P.; Data as of December 2023
Business Cycle: Inflation Conditions (I)
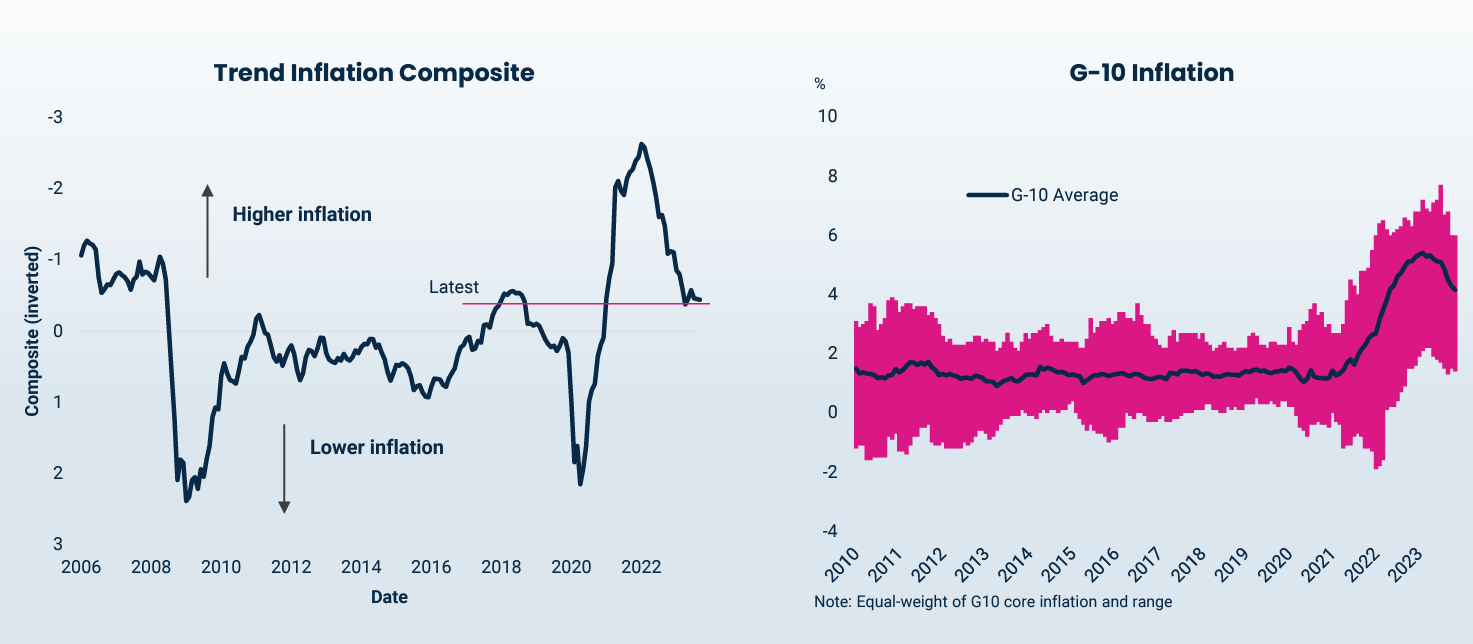
- Global inflation reversal bolsters the supply-driven narrative of inflation since the pandemic.
- This reversal allows central banks to become more cautious with rate policy. There are few countries left with hikes priced in 2024.
- In advanced economies, central banks are eager to reduce their balance sheets at the expense of hikes.
- The lasting impact of the inflation spike, so far, is a lower probability of deflation rather than lingering fears of high inflation.
For more information about Harbor's indicators and models, please see the end of this document. For hypothetical and Illustrative purposes only.This information should not be considered as a recommendation to purchase or sell a particular security.
Sources: Harbor MAST, Bloomberg L.P., Data as of December 2023
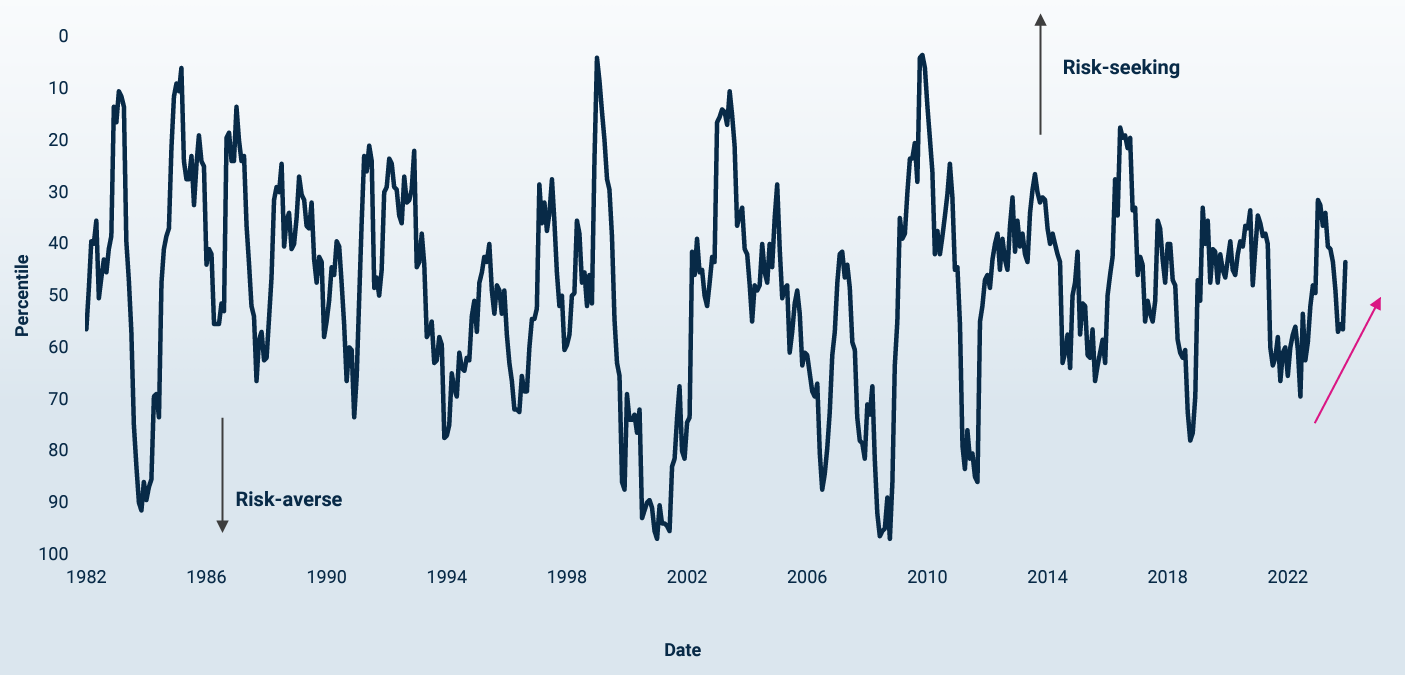
Market Sentiment
- The recession obsession is giving way to optimism after the Fed’s December pivot.
- While far from exuberant, market internals have shifted towards more cyclical and risk-on positioning.
- The strong finish to Q4 closed some of the valuation gap between deep cyclicals and the Magnificent 7, but we believe there is ample room to run if the U.S. economy realizes a soft landing.
For more information about Harbor's indicators and models, please see the end of this document. For hypothetical and Illustrative purposes only.This information should not be considered as a recommendation to purchase or sell a particular security.
Sources: Harbor MAST, Data as of December 2023
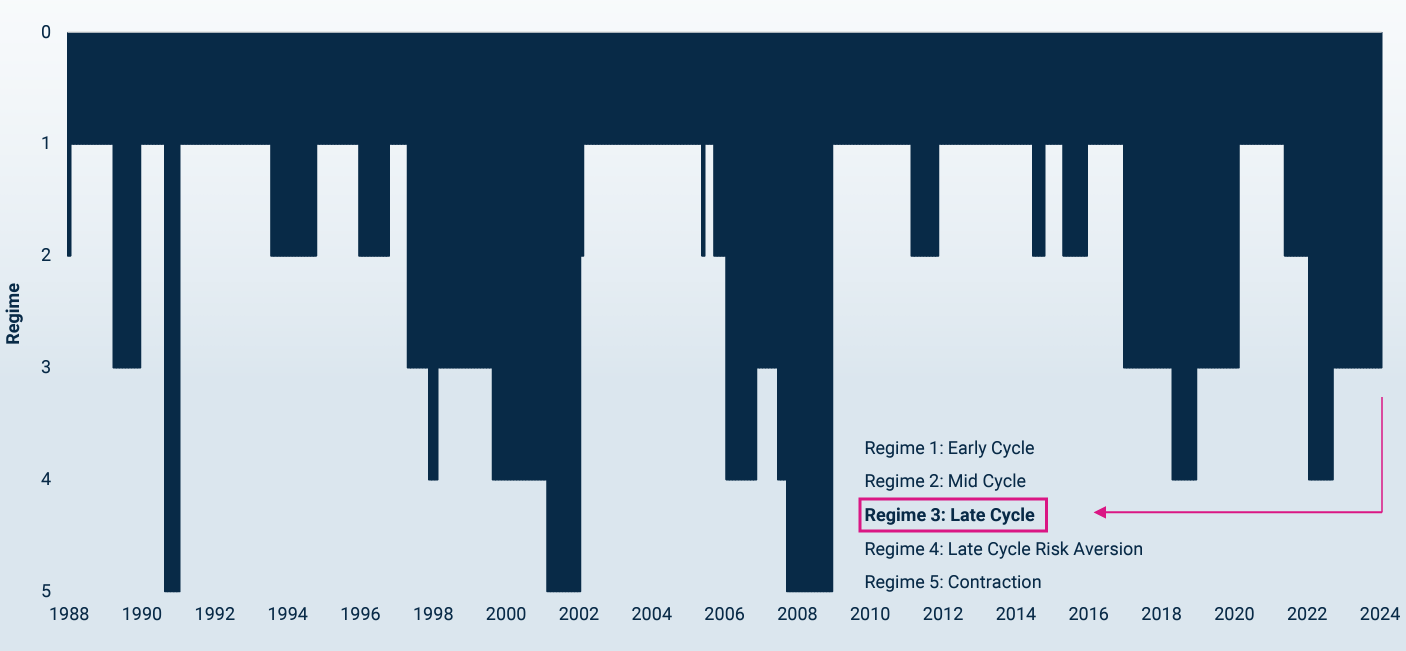
GLI + Market Sentiment = Business Cycle Regime
- We believe global growth remains below trend with our Business Cycle model suggesting the U.S. economy is in a “Late-Cycle” environment, though it remains a two-track economy with a strong services sector offsetting an ongoing manufacturing recession.
- Market sentiment has remained “risk-seeking” since November of 2023 and, we feel, has improved significantly in the 4th quarter as the Fed shifted the conversation from hikes to cuts. Markets are turning back the cycle clock as a soft landing could shift us back into “Early-Cycle.”
For more information about Harbor's indicators and models, please see the end of this document. For hypothetical and Illustrative purposes only.This information should not be considered as a recommendation to purchase or sell a particular security.
Sources: Harbor MAST, Data as of December 2023
Business Cycle Regime: Generalized Positioning Key
Cross-Asset Positioning| Regime | Equities | Credit | Bonds | Gold | Cash |
|---|---|---|---|---|---|
| Early Cycle | Strong Overweight | Strong Overweight | Strong Underweight | Neutral | Neutral |
| Mid Cycle | Overweight | Overweight | Overweight | Neutral | Neutral |
| Late Cycle | Overweight | Overweight | Neutral | Neutral | Overweight |
| Late Cycle Risk Averse | Underweight | Underweight | Overweight | Overweight | Overweight |
| Contraction | Strong Underweight | Strong Underweight | Strong Overweight | Strong Overweight | Strong Overweight |
Intra-Equity Positioning
| Regime | Equities | Credit | Bonds | Gold | Cash |
|---|---|---|---|---|---|
| Early Cycle | Strong Overweight | Neutral | Strong Underweight | Strong Overweight | Neutral |
| Mid Cycle | Neutral | Neutral | Overweight | Neutral | Overweight |
| Late Cycle | Underweight | Strong Overweight | Underweight | Underweight | Strong Overweight |
| Late Cycle Risk Averse | Strong Underweight | Strong Underweight | Strong Overweight | Strong Underweight | Overweight |
| Contraction | Strong Underweight | Strong Underweight | Strong Overweight | Strong Underweight | Overweight |
For more information about Harbor's indicators and models, please see the end of this document. For hypothetical and Illustrative purposes only.This information should not be considered as a recommendation to purchase or sell a particular security.
Sources: Harbor MAST, Data as of December 2023
Important Information
The views expressed herein are those of the Harbor Multi Asset Solutions Team at the time the comments were made. They may not be reflective of their current opinions, are subject to change without prior notice, and should not be considered investment advice. These views are not necessarily those of the Harbor Investment Team and should not be construed as such. The information provided is for informational purposes only.
Past performance is no guarantee of future results.
All investments are subject to market risk, including the possible loss of principal. Stock prices can fall because of weakness in the broad market, a particular industry, or specific holdings. Bonds may decline in response to rising interest rates, a credit rating downgrade or failure of the issue to make timely payments of interest or principal. International investments can be riskier than U.S. investments due to the adverse affects of currency exchange rates, differences in market structure and liquidity, as well as specific country, regional, and economic developments. These risks are generally greater for investments in emerging markets.
Fixed income securities fluctuate in price in response to various factors, including changes in interest rates, changes in market conditions and issuer-specific events, and the value of an investment may go down. This means potential to lose money.
As interest rates rise, the values of fixed income securities are likely to decrease and reduce the value of a portfolio. Securities with longer durations tend to be more sensitive to changes in interest rates and are usually more volatile than securities with shorter durations. Interest rates in the U.S. are near historic lows, which may increase exposure to risks associated with rising rates. Additionally, rising interest rates may lead to increased redemptions, increased volatility and decreased liquidity in the fixed income markets.
Diversification does not assure a profit or protect against loss in a declining market. Indices listed are unmanaged, and unless otherwise noted, do not reflect fees and expenses and are not available for direct investment.
Diversification does not assure a profit or protect against loss in a declining market. Indices listed are unmanaged, and unless otherwise noted, do not reflect fees and expenses and are not available for direct investment.
Investing entails risks and there can be no assurance that any investment will achieve profits or avoid incurring losses.
Important Information About Harbor's Models and Indicators
Certain forecasts, estimates and returns are based on hypothetical assumptions. It is for informational and hypothetical purposes only. This material does not constitute investment advice and should not be viewed as a current or past recommendation or a solicitation of an offer to buy or sell any securities or to adopt any investment strategy. The forecasts, estimates and return presented do not represent the results that any particular investormayactually attain. Actual performance results will differ, and may differ substantially, from the hypothetical information provided. There is no guarantee that any of the forecasts and projections will come to pass.
Performance indices on slide 4 are as follows: U.S. Large Cap, the S&P 500 Index; U.S. SMID Cap, the Russell 2500 Index; Western Europe, FTSE Developed Europe All Cap Net TaxIndex; Japan, MSCI Japan Index; Emerging Markets, MSCI Emerging Markets Index; Treasuries, the Bloomberg U.S. Treasury Index; Municipals, the Bloomberg U.S. Municipals Index;IG Corp, the Bloomberg U.S. Corporate Bond Index; MBS, the Bloomberg U.S. Mortgage-backed Securities Index; ABS, the Bloomberg U.S. Agg ABS Index; Euro IG, the Bloomberg Euro-Aggregate Corporates Index; EMD ($), the Bloomberg Emerging Markets Hard Currency Aggregate Index; EM IG Corp, the Bloomberg Emerging Markets Investment Grade Index; EuroHY, the Bloomberg Pan-European High Yield Index; US HY, the Bloomberg U.S. Corporate High Yield Bond Index; Leveraged Loans, the Morningstar LSTA U.S. Leveraged Loan Index.
Performance indices on slide 4 are as follows: U.S. Large Cap, the S&P 500 Index; U.S. SMID Cap, the Russell 2500 Index; Western Europe, FTSE Developed Europe All Cap Net TaxIndex; Japan, MSCI Japan Index; Emerging Markets, MSCI Emerging Markets Index; Treasuries, the Bloomberg U.S. Treasury Index; Municipals, the Bloomberg U.S. Municipals Index;IG Corp, the Bloomberg U.S. Corporate Bond Index; MBS, the Bloomberg U.S. Mortgage-backed Securities Index; ABS, the Bloomberg U.S. Agg ABS Index; Euro IG, the Bloomberg Euro-Aggregate Corporates Index; EMD ($), the Bloomberg Emerging Markets Hard Currency Aggregate Index; EM IG Corp, the Bloomberg Emerging Markets Investment Grade Index; EuroHY, the Bloomberg Pan-European High Yield Index; US HY, the Bloomberg U.S. Corporate High Yield Bond Index; Leveraged Loans, the Morningstar LSTA U.S. Leveraged Loan Index.
The Harbor Liquidity Cycle Indicator is a proprietary Indicator used by the Multi-Asset Solutions Team to measure the prevailing conditions that we believe drive the Central Bank’s reaction function. The Indicator utilizes a set of indicators that are standardized and then aggregated into a singular composite score. The input variables measure growth momentum, inflation, normalized equity market valuations, and levels of leverage across the private sector and consumer. Liquidity Cycle Indicator Sources: Harbor MAST, Bloomberg, Institute of Supply Management, Federal Reserve, Bureau of Labor Statistics. The Liquidity Cycle Indicator assumes that the historical relationship between the selected indicators and future liquidity conditions remain stable. A limiting factor for our modeling approach is if these relationships change, our models may be less accurate in terms of measuring the conditions that drive liquidity.
The Trend Inflation Composite is a proprietary Indicator used by the Multi-Asset Solutions Team to measure the prevailing conditions that we believe drive realized inflation. The Indicator utilizes a set of indicators that are standardized and then aggregated into a singular composite score. The input variables measure wages, commodity prices, labor demand, and inflation data inputs. Trend Inflation Composite Sources: Harbor MAST, Bloomberg, Institute of Supply Management, Federal Reserve, Mortgage Bankers Association, U.S. Department of Commerce, Bureau of Labor Statistics.
The Market Sentiment Indicator is a proprietary Indicator used by the Multi-Asset Solutions Team to measure the prevailing conditions that we believe explain market sentiment. The input variables are predominantly market price variables that reflect price momentum across various styles and sectors within equities, credit, fixed income and commodities markets. Market Sentiment Indicator Sources: Harbor MAST, Bloomberg. A limiting factor for our modeling approach is if these relationships change, our models may be less accurate in terms of measuring the conditions that drive market sentiment.
3337256


