 Contact
International Investing Q&A
October 28, 2022


Executive Summary
- It is no secret that international markets are facing a multitude of macro headwinds. The war in the Ukraine, energy supply constraints, elevated inflation, and slowing economic growth have all weighed heavily on international equities.
- However, one question for investors is how much of this sentiment has been baked into international stock prices and does this present opportunity? In some cases, valuations are at or near decade low multiples while dividend yields have reached levels not seen in years.
- Given this backdrop, we seek expert advice and delve deeper into various segments of the international equity markets that may be top-of-mind for investors.
Looking at Europe, a common concern we have been hearing is that consumer spending on discretionary items will drop dramatically in this environment due to rapidly rising cost of living expenses. Do you share this view? If so, how have you been positioning your portfolio?
Europe is dealing with a specific challenge around energy supply that has dramatically increased costs for consumers. This energy dynamic is not present in the US or in developed markets in Asia. It seems logical to assume that consumer budgets will come under pressure. Governments in the UK, France, Germany, and others have responded to this dynamic by enacting various price caps and safety nets. At this point, there does not appear to be any clear-cut evidence of a consumer spending disaster in Europe. We tend to focus on bottom-up fundamentals -- specifically around valuation.
The MSCI Europe Consumer Discretionary Index currently trades near decade-low earnings multiples and about one-third of the earnings multiple of the equivalent S&P 500 sector index1. Relative to their own history and compared to the US, consumer stocks in Europe appear to have already discounted much of the expected bad news. As natural contrarians, we would seek to take advantage of current discounts and add to our consumer positions.
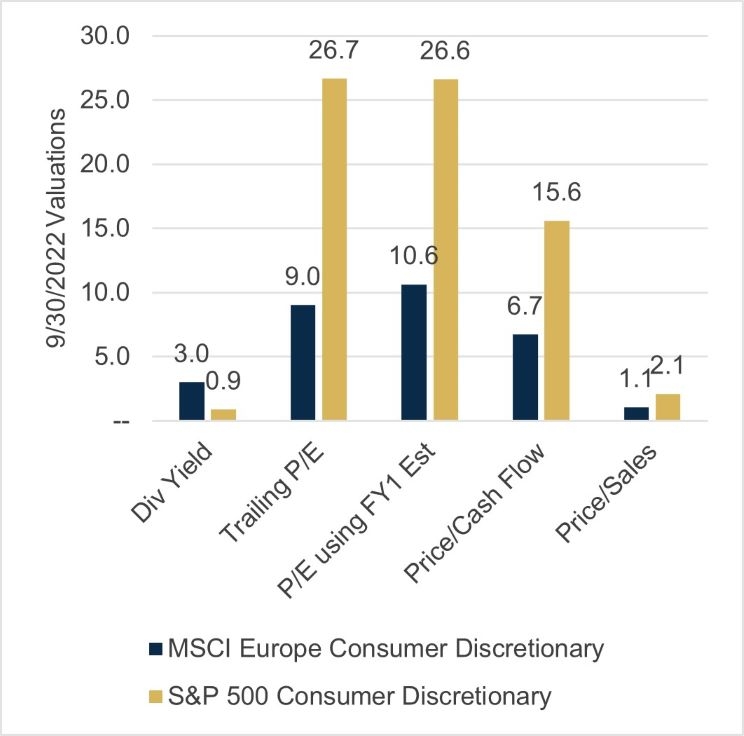
Source: FactSet, September 2022
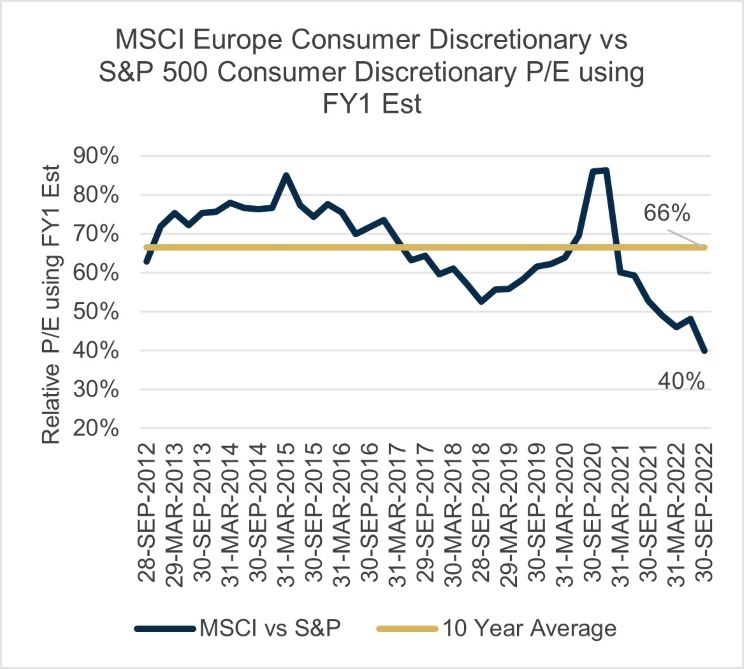
Source: Factset
Specifically looking at the UK, there has been news of tax cuts along with the temporary long-dated bond purchase program. How do you view the UK risks vs opportunities in this current backdrop?
The UK market since the initial Brexit vote in 2016 has experienced significant multiple compression that has now been exacerbated by highly negative currency dynamics. That said, productivity of many UK businesses, especially many of the more dynamic small and mid-cap companies has been excellent. To uncover these opportunities, we believe an active management approach can yield better opportunities than a broad-based "buy the market" approach. We aim to seek out businesses that have significant pricing power with the ability to generate solid, double-digit returns on equity (ROE) regardless of the market cycle. The multiple compression experienced in the UK has allowed us to build positions in higher quality businesses than had been the case for many years. Although we have been underweight in the UK since Brexit, we continue to selectively build our positions given attractive valuation entry points.
Currency weakness has been immense in this environment as the U.S. has been viewed as relatively safe haven in this volatile environment combined with rapidly rising interest rates. Can you comment on how your portfolio is exposed to these currency movements?
The strengthening US dollar has been a significant headwind for non-US assets for a couple of years now, but this trend really accelerated in 2022 with gains of 16% against the EUR, +20% against the GBP, and 25% against the JPY, YTD2 through Sept. 30, 2022. Consequently, through the first 3 quarters of 2022, about 3/4 of the absolute declined in value of the Harbor International Small Cap Fund has been due to currency translation effects. While these declines are painful to experience, we are mindful that currency dynamics will likely have a positive impact on companies in the portfolio that have significant dollar-based revenues. In addition, significant currency swings have a tendency to mean revert, which could produce a performance tailwind in the future. In other words, new investors in the fund will potentially have two opportunities to benefit in the future: 1) earnings growth and 2) mean reversion of currency translation effects.

Source: FactSet, September 2022

Source: FactSet, September 2022

Annualized Total Returns as of 9/30/2022
Performance data shown represents past performance and is no guarantee of future results. Past performance is net of management fees and expenses and reflects reinvested dividends and distributions. Past performance reflects the beneficial effect of any expense waivers or reimbursements, without which returns would have been lower. Investment returns and principal value will fluctuate and when redeemed may be worth more or less than their original cost. Returns for periods less than one year are not annualized. Current performance may be higher or lower and is available through the most recent month end at harborcapital.com or by calling 800-422-1050.
Valuations for the MSCI EAFE and MSCI EAFE Small Cap Indices are at attractive levels from both an absolute and relative to the U.S. standpoint. How are you feeling about the valuations of your portfolio right now? How much is the market pricing in this challenged environment and what catalysts do you think could lead to a reversal?
We have been highlighting what we believe is a substantial valuation disconnect between growth-style and value-style equities for several years. While the absolute decline in our fund is very painful, we believe this is part of a normal market dynamic that is wringing out speculative excesses. Because we strive to invest based on valuations tied to bottom-up fundamentals, we feel confident in the positioning of the portfolio. During broad market selloffs such as the one we seem to be currently experiencing, very few equity markets can avoid declines. That said, current valuations for the MSCI EAFE Small Cap Index are right around Global Financial Cycle and Dot-Com era levels potentially discounting downside risk scenarios that may be too extreme relative to underlying fundamentals.

Source: FactSet, September 2022
We believe central bank tightening to combat inflation will likely continue for some time causing disproportionate declines in the most speculative corners of equity markets as rising rates produce much lower valuations for long duration assets. That said, we believe some combination of visibility on the end of the tightening cycle and/or reduction to geopolitical tensions in Eastern Europe and Asia could potentially reverse the current down cycle. Our strategy continues to focus on redeploying assets from lower quality businesses to better quality businesses that we believe are better positioned to take advantage of the current inflationary environment and, in our view, have strong valuation support.
Non-US equity markets have historically provided investors with attractive dividend yields and with equity weakness those yields have gotten to very attractive levels. Why is it that non-US companies tend to pay higher dividends? And do you expect your portfolio companies to be able to maintain their dividends in this environment?
In our view, dividend payments tend to be a function of capital allocation strategies that are often linked to corporate culture. Although the factors that drive capital allocation strategies are unique and often distinct from country to country, we have found some common themes that often lead to a preference for dividend payments over other capital allocation strategies. Financial services companies, for example, are often operating under a more strict and conservative regulatory authority that often makes dividends the preferred method of returning capital to shareholders. It is also the case, especially with small cap companies, that many non-US companies have significant family ownership, with families that prefer dividends over share buy-backs to limit concentration risk. In some markets, the payment of dividends is also considered a status symbol or a signal of economic strength relative to competitors or other members of an equity market. In recent years, dividend yields in non-US equities have also acted as a relative valuation measure especially when compared to US equity markets. Higher yields result from lower valuations relative to earnings and free cash flow.
Broadly speaking, we do not seek out high dividend yielding stocks just for the sake of dividends. Instead, our valuation framework considers multiple valuation measures, including dividend yield, in the context of a company's fundamentals not just on absolute cheapness. For example, we have generally avoided Real Estate investments for several years now precisely because the productivity of the underlying assets was very low, even relative to their absolute cheapness. As a result, we believe companies in our portfolio that have higher dividend yields will, for the most part, have the financial strength to sustain their payouts through a full market cycle.

Source: FactSet, September 2022
Dividend Yield = Divi/Pi
- Divi: = Annual dividends per share (DPS) for security i as defined by the Fundamentals database source as of the report date
- Pi: = Closing price of security i as of the report date
Prices are provided by the FactSet Security Prices library. If the "latest" date is used, intraday prices are provided by the exchange when available.
Annualized Total Returns as of 9/30/2022
Performance data shown represents past performance and is no guarantee of future results. Past performance is net of management fees and expenses and reflects reinvested dividends and distributions. Past performance reflects the beneficial effect of any expense waivers or reimbursements, without which returns would have been lower. Investment returns and principal value will fluctuate and when redeemed may be worth more or less than their original cost. Returns for periods less than one year are not annualized. Current performance may be higher or lower and is available through the most recent month end at harborcapital.com or by calling 800-422-1050.
Current 30-Day Yields are for the Institutional Class and represent the average annualized income dividend over the last 30 days excluding gains and losses as defined by the SEC. Current 30-Day Yield is the Current 30-Day Subsidized SEC Yield and reflects reimbursements or waivers of fees currently in effect. Current 30-Day Yield-Unsub is the Current 30-Day Unsubsidized SEC Yield and does not reflect reimbursements or waivers of fees currently in effect.
Expense ratio information is as of the Fund’s current prospectus, as supplemented. Gross expenses are the Fund’s total annual operating expenses.
While challenges and potential opportunity exists for international equity investors, we believe that using an active approach to navigate this complex environment may yield better outcomes for investors.
For more information, please access our website at www.harborcapital.com or contact us at 1-866-313-5549.
Important Information
1 FactSet as of 9/30/2022
2 FactSet as of 9/30/2022
Investing entails risks and there can be no assurance that any investment will achieve profits or avoid incurring losses.
There is no guarantee that the investment objective of the Fund will be achieved. Stock markets are volatile and equity values can decline significantly in response to adverse issuer, political, regulatory, market and economic conditions. Investing in international and emerging markets poses special risks, including potentially greater price volatility due to social, political and economic factors, as well as currency exchange rate fluctuations. These risks are more severe for securities of issuers in emerging market regions.
Stocks of small cap companies pose special risks, including possible illiquidity and greater price volatility than stocks of larger, more established companies.
This material does not constitute investment advice and should not be viewed as a current or past recommendation or a solicitation of an offer to buy or sell any securities or to adopt any investment strategy.
The views expressed herein are those of Cedar Street Asset Management LLC investment professionals at the time the comments were made. They may not be reflective of their current opinions, are subject to change without prior notice, and should not be considered investment advice. The information provided in this presentation is for informational purposes only.
Indices listed are unmanaged, and unless otherwise noted, do not reflect fees and expenses and are not available for direct investment.
The MSCI Europe Index is a stock market index that is designed to capture the large and mid cap segments across 15 Developed Markets (DM) countries in Europe*. All securities in the index are classified in the Consumer Discretionary sector as per the Global Industry Classification Standard (GICS®).
The S&P 500 Index is an unmanaged index generally representative of the U.S. market for large capitalization equities. This unmanaged index does not reflect fees and expenses and is not available for direct investment.
The MSCI EAFE Small Cap Index is an equity index which captures small cap representation across Developed Markets countries* around the world, excluding the US and Canada. With 2,329 constituents, the index covers approximately 14% of the free float- adjusted market capitalization in each country.
Dividend Yield is the weighted average trailing 12 months dividends per share divided by the closing price of each security.
Trailing P/E - Trailing price-to-earnings (P/E) is a relative valuation multiple that is based on the last 12 months of actual earnings. It is calculated by taking the current stock price and dividing it by the trailing earnings per share (EPS) for the past 12 months.
P/E Using FY1 Est - The Forward 1 Year Price to Earnings (PE) Ratio is similar to the price to earnings ratio.
While a regular P/E ratio is a current stock price over it's earnings per share, a forward P/E ratio is a current stock's price over its predicted earnings per share for the next fiscal year.
Price/Cash Flow - The price-to-cash flow (P/CF) ratio is a stock valuation indicator or multiple that measures the value of a stock's price relative to its operating cash flow per share. The ratio uses operating cash flow (OCF), which adds back non-cash expenses such as depreciation and amortization to net income.
Price/Sales - The price-to-sales ratio (Price/Sales or P/S) is calculated by taking a company's market capitalization (the number of outstanding shares multiplied by the share price) and divide it by the company's total sales or revenue over the past 12 months. The lower the P/S ratio, the more attractive the investment.
Cedar Street Asset Management LLC is the subadvisor to the Harbor International Small Cap Fund.
2563520


