


A Note from Harbor
Harbor has been in a strategic partnership with Income Research + Management (IR+M) for over a decade. Harbor is pleased to present some insights from IR+M, “Commercial ABS Debt Maturity Wall: Moment of Truth” that we hope intermediaries find helpful in their portfolio construction efforts.
Introduction
- Senior Research Analyst Scott Hofer at IR+M is providing an update on refinancing risk for ABS with balloon payment structures.
- As interest rates remain stubbornly high, IR+M analysis indicates that ABS past due1 could more than double by the end of 2026 to over $10 billion.
- Some ABS sponsors now face a moment of truth: Inject equity into their deals or let low‑coupon bonds languish in refinancing limbo.
- At IR+M, they prioritize refinancing risk in their analysis, given the inherent limitations of structured finance ratings.
1 “Past due” herein refers to Asset‑Backed Securities that remain outstanding beyond their Anticipated Repayment Date, as well as Class C tranches from aircraft ABS that remain outstanding beyond their expected final payment date.
The Perfect Refinancing Storm
It may seem hard to imagine, but according to IR+M just five years ago, homebuyers in the United States could secure a mortgage at under 3.0%, the U.S. Treasury could lock in long‑term financing at just 2%, and ABS issuers with high leverage and balloon‑style repayment features could achieve yields as low as 1.5% on novel securitizations. IR+M saw this accommodative rate environment entice a variety of issuers to access the capital markets, with ABS being the market of choice for deals backed by long‑dated contracts that could be securitized into highly rated tranches of debt.
Fast forward to November 2025, and what appeared to be the easy money times of 2020–2021 seem like a distant memory. Per IR+M research, bond yields for certain ABS have more than doubled, creating problems for key performance metrics such as debt service coverage2 and excess spread3. Making matters worse, the long‑dated nature of the ABS collateral contracts — once viewed as a credit positive — appear to have failed to keep up with the dramatic spike in interest rates, creating an asset/liability mismatch as 5–7 year Anticipated Repayment Date (ARDs) come due. These factors have created what IR+M sees as a ‘perfect storm’ for certain ABS issuers that took on debt at rock‑bottom rates in 2020/2021, with some surprising results: Deals with long‑dated contracts and highly‑rated tenants have underperformed some shorter, higher‑yielding asset classes with a larger buffer against rising rates.
2 “Debt service coverage” refers to the ratio of net collateral cash flow to debt servicing costs. Typically, the Debt Service Coverage Ratio (DSCR) for Commercial ABS needs to exceed a minimum ratio between 1.5× and 2.0× to enable the issuance of refinancing debt.
3 “Excess spread” refers to the interest generated on the collateral (net of fees) less interest costs on the debt. Excess spread can comprise a significant portion of overall credit enhancement in an ABS and is commonly referred to as “soft enhancement”, in contrast to overcollateralization or “hard” enhancement.
Refinancing Risk Revisited: Ratings and Collateral Performance No Longer Leading Indicators
According to IR+M, heading into 2025, refinancing risk was largely confined to the Whole Business Securitization (WBS) and aircraft leasing ABS sectors, both of which faced credit‑related headwinds due to the COVID‑19 pandemic. While interest rates may have played a role on the margin, the deals that failed to refinance in the years leading up to 2025 suffered steep reductions in top‑line revenue, resulting in, per IR+M, ratings downgrades well in advance of ARDs.
Just recently, a third sector — triple‑net lease ABS — entered the ‘past due’ category. Unlike the aircraft and WBS deals that failed to refinance before them, however, poor collateral performance did not precede the missed payment. Indeed, the $1.4B of bonds that failed to be refinanced in July of 2025 carried relatively high ratings of ‘A+’ and ‘A‑’, with an outlook of ‘stable’. Rather than credit‑related stress, IR+M believes high financial leverage and a spike in debt servicing costs were the main reasons for the failed refinancing — signaling that bond structure and refinance‑ability had become key risks for ABS bond buyers. While failure to refinance an ABS at its ARD does not impact a bond’s structured finance rating, it nonetheless has big implications for bond pricing and duration, as bondholders now face a payment window that may stretch decades beyond the ARD.4
4 ABS bonds are rated to a “legal final payment date” that can stretch several decades beyond the Anticipated Repayment Date. Once an ABS passes its ARD, all residual cash flows are re‑directed from the issuer to pay down the debt. Structured finance ratings reflect the likelihood of bondholders being paid in full by the legal final, not the ARD.
IR+M prioritizes refinancing risk in their underwriting process as this sets the highest bar for deal performance. Cash trapping and rapid amortization triggers are often set meaningfully below the required debt service coverage for issuing refinancing debt, providing a false sense of cushion within the deal — particularly those with high structured finance ratings but excruciatingly long repayment timelines post ARD.
Exhibit 1: Outstanding Balance of ABS Past Due ($B) vs. 5‑Year U.S. Treasury Yield (%)
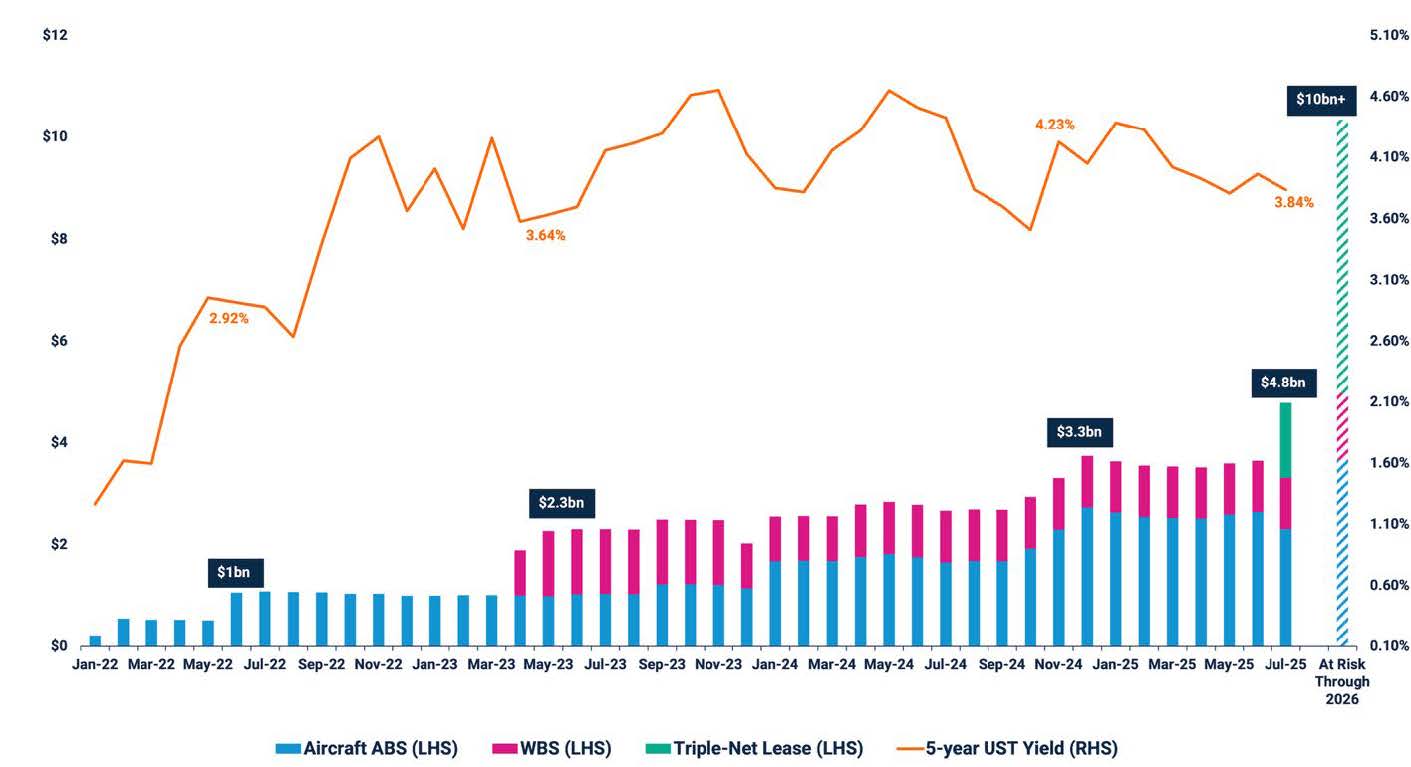
Past performance is not indicative of future results. Source: Bloomberg, 2025; Includes over $500M of Class C aircraft ABS tranches with original ratings below BBB‑ that remain outstanding beyond their expected final payment dates.
Exhibit 2: Balloon‑Payment ABS Debt Coming Due Through 2026 ($M) & Existing Senior Cost of Debt (%)
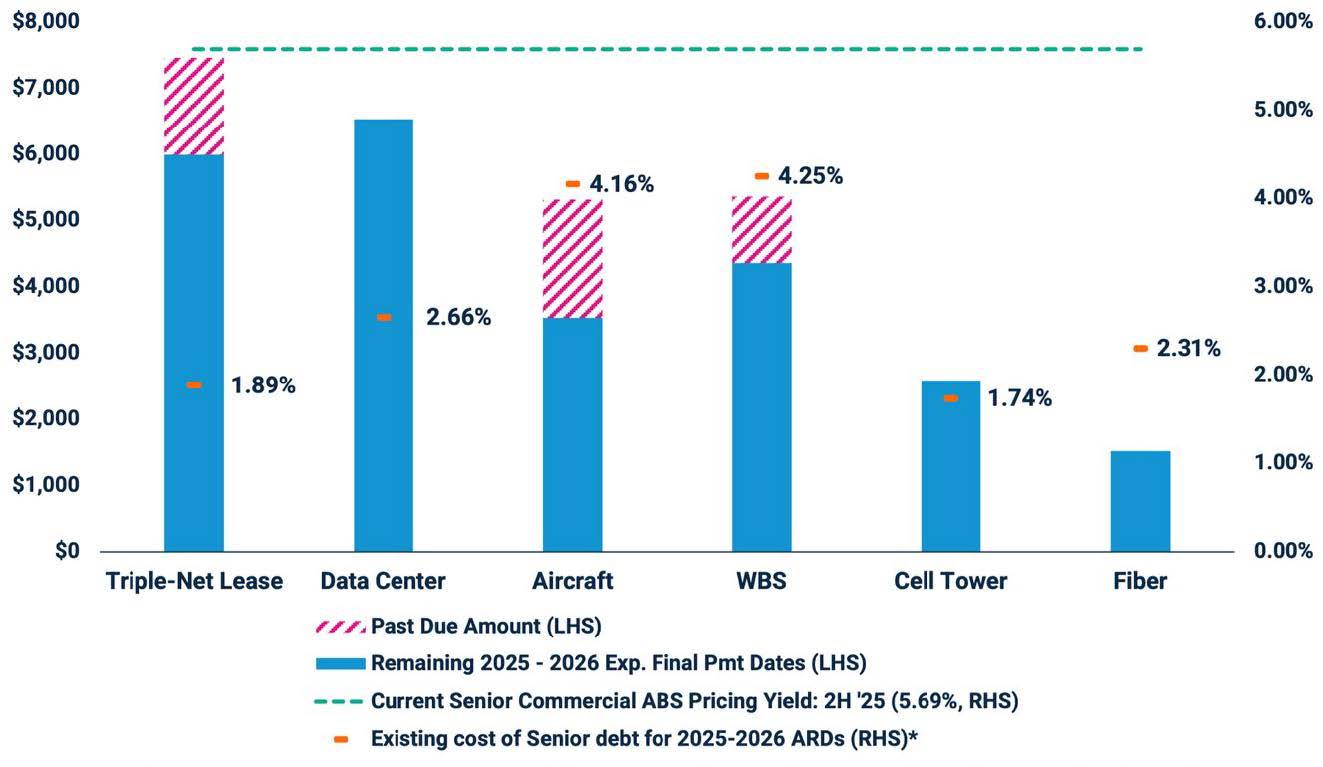
Past performance is not indicative of future results. Source: Bloomberg, 2025
Refinancing Risk Through 2026: An Additional $5B+ at Risk
As interest rates continue to remain stubbornly high, IR+M believes that an additional $5B+ of triple‑net lease ABS could face refinancing issues through 2026, with other borrowers with balloon repayment features potentially facing stress as well. Issuers in the data center, cell tower leasing, and fiber ABS sectors are not immune to refinancing risk, although to date, issuers in these sectors have avoided missing ARDs thanks to crafty deal structuring and the addition of more assets to the trust. Indeed, issuers in these sectors have managed to stave off higher rates by gradually adding more collateral to the pools and laddering ARDs, which have simultaneously increased cash flow and lowered the deal’s sensitivity to rates. In addition, “springing amendments” have been introduced on a new series of debt, loosening the covenants tied to allowable debt service coverage and the very definition of “debt service coverage” itself.5 Taken altogether, these actions have reduced the maturity “wall” to a manageable amount and provided issuers with additional runway, keeping borrowers true to their anticipated repayment schedules. The ability to add assets and slowly adjust the cost of debt to market rates has been key, as these sectors also employ relatively high financial leverage.
5 “Debt service coverage” for many ABS deals now can refer to a senior‑only debt service coverage ratio, which excludes Class B interest and scheduled principal (where applicable).
Per IR+M – The Moment of Truth: Inject Equity, or Send Bond Prices Tumbling Downward
IR+M believes issuers that have failed to ladder their ARDs, add assets to the trust, and even out the cost of debt now face a ‘moment of truth’: Inject equity into the deals, or let low‑coupon bonds languish in refinancing limbo. At today’s interest rates, the debt service coverage ratio on many deals issued in 2020/2021 would collapse, putting the issuance of refinancing debt in violation of bond covenants and rating agency criteria. Furthermore, asset values for many types of commercial real estate have fallen over the last few years, they believe making asset sales a non‑viable path to reducing debt.
IR+M sees the only solution to properly de‑levering many of these deals, outside of modifying coupon rates/ARDs, could be to replace a portion of the debt with equity to prop up the debt service coverage (and simultaneously decrease the loan‑to‑value ratio). While sponsors of ABS have no obligation to inject equity given the non‑recourse nature of the deals, it appears to be the only feasible path to “fixing” these over‑levered transactions. Time is of the essence, as the subordinated post‑ARD step‑up interest6 starts to accrue after the ARD, which could effectively prevent the deal from de‑levering and becoming refinanceable in the future.
6 Post‑ARD step‑up interest is fully subordinated in the payment waterfall to both senior and subordinated bond principal and therefore has equity‑like features. It accrues at a minimum rate of [5]% and is incentivize issuers to refinance their deals before the ARD.
Will securitization sponsors use their own equity to refinance their ABS deals, or let low‑coupon bonds tumble in price as repayment windows extend? Perhaps ABS sponsors may build equity in a different manner — by buying back their bonds at a steep discount to par and cancelling out the post‑ARD step‑up interest on the debt they own. The question then becomes, how low do bond prices have to go, and when could a debt buyback take place? IR+M says, stay tuned as the drama unfolds.
Exhibit 3: Select Triple‑Net Lease ABS Bond Pricing: September 2024 – September 2025 ($)
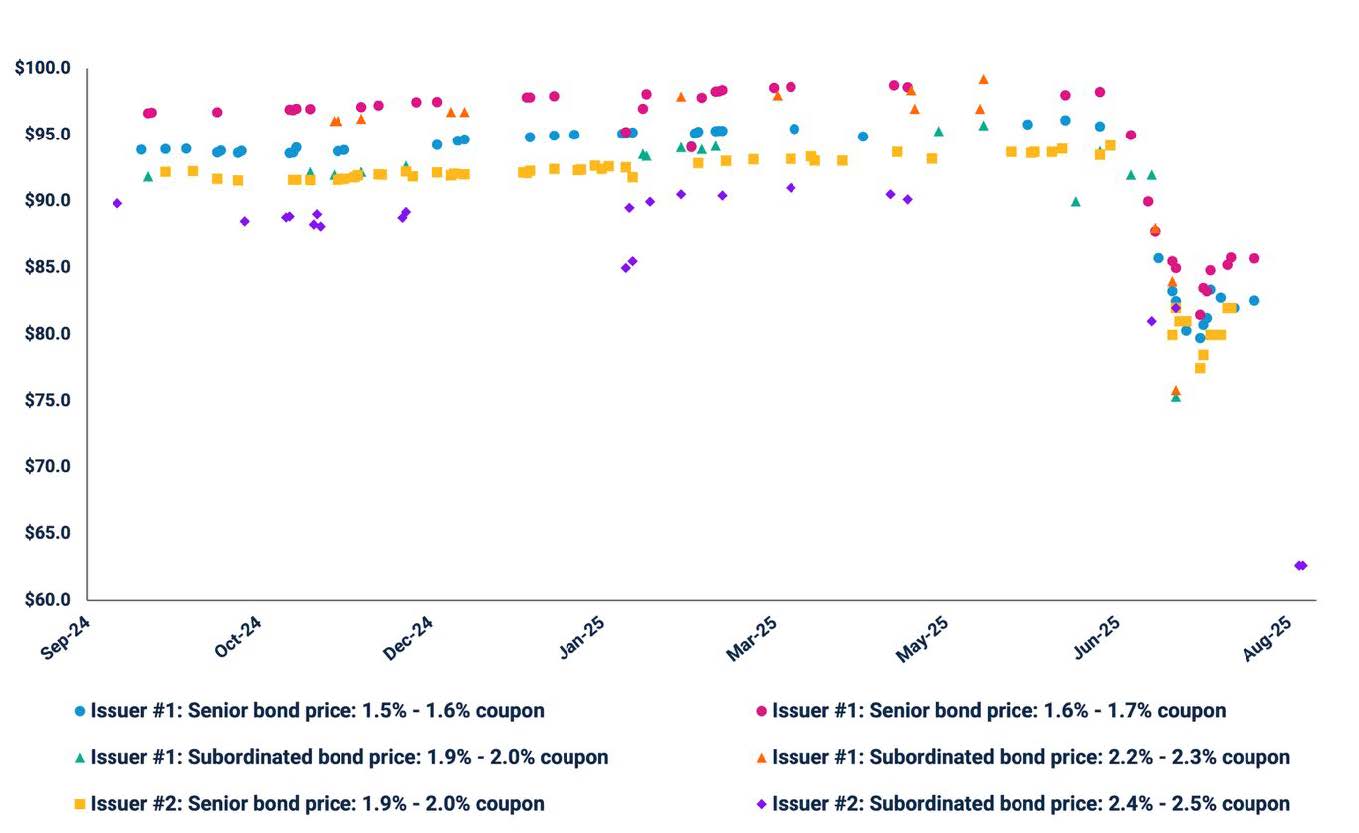
Past performance is not indicative of future results. Source: Bloomberg, 2025
Important Information
Insights provided by Harbor Capital Advisors, Inc. in collaboration with Income Research + Management (IR+M).
Sources for all charts: Bloomberg. Universes analyzed include outstanding U.S.‑dollar‑denominated investment‑grade deals as of 8/21/25. Exhibit 1: Outstanding balance past due as of July 2025. 5‑year Treasury yield represents the bond yield on the first business day of each month. Yields labeled correspond to grey box dates when the amount surpasses each new billion mark. The grey boxes represent the bonds that should have matured but have been extended. The at risk through 2026 is the amount of bonds that IR+M thinks will extend past their maturities in 2026. Exhibit 2: WBS = Whole Business Securitizations. Includes deals issued in 2025 through 8/21/25. Exhibit 3: Based on TRACE pricing via Bloomberg through 8/21/25.
The views contained in this report are those of Income Research + Management (“IR+M”) and are based on information obtained by IR+M from sources that are believed to be reliable but IR+M makes no guarantee as to the accuracy or completeness of the underlying third‑party data used to form IR+M’s views and opinions. This report is for informational purposes only and is not intended to provide specific advice, recommendations, or projected returns for any particular IR+M product.
Investing in securities involves risk of loss that clients should be prepared to bear. More specifically, investing in the bond market is subject to certain risks including but not limited to market, interest rate, credit, call or prepayment, extension, issuer, and inflation risk. It should not be assumed that the yields or any other data presented exist today or will in the future. Past performance is not a guarantee of future results and current and future portfolio holdings are subject to risk. Securities listed in this presentation are for illustrative purposes only and are not a recommendation to purchase or sell any of the securities listed. Forward looking analyses are based on assumptions and may change. It should not be assumed that recommendations made in the future will be profitable or will equal the performance of the securities listed. Some statistics require assumptions for calculations which can be disclosed upon request.
“Bloomberg®” and Bloomberg Indices are service marks of Bloomberg Finance L.P. and its affiliates, including Bloomberg Index Services Limited (BISL), the administrator of the index (collectively, “Bloomberg”), and have been licensed for use for certain purposes by IR+M. Bloomberg is not affiliated with IR+M, and Bloomberg does not approve, endorse, review, or recommend the products described herein. Bloomberg does not guarantee the timeliness, accuracy, or completeness of any data or information relating to any IR+M product.
The views expressed herein may not be reflective of current opinions, are subject to change without prior notice. This material does not constitute investment advice and should not be viewed as a current or past recommendation or a solicitation of an offer to buy or sell any securities or to adopt any investment strategy. This material may contain forward‑looking information that is not purely historical in nature. Such information may include, among other things, projections and forecasts. There is no guarantee that any of these views will come to pass.
Copyright © (2025) Harbor Capital Advisors, Inc. All Rights Reserved.