 Contact
High-Yield Bonds: Opportunities & Considerations
April 02, 2024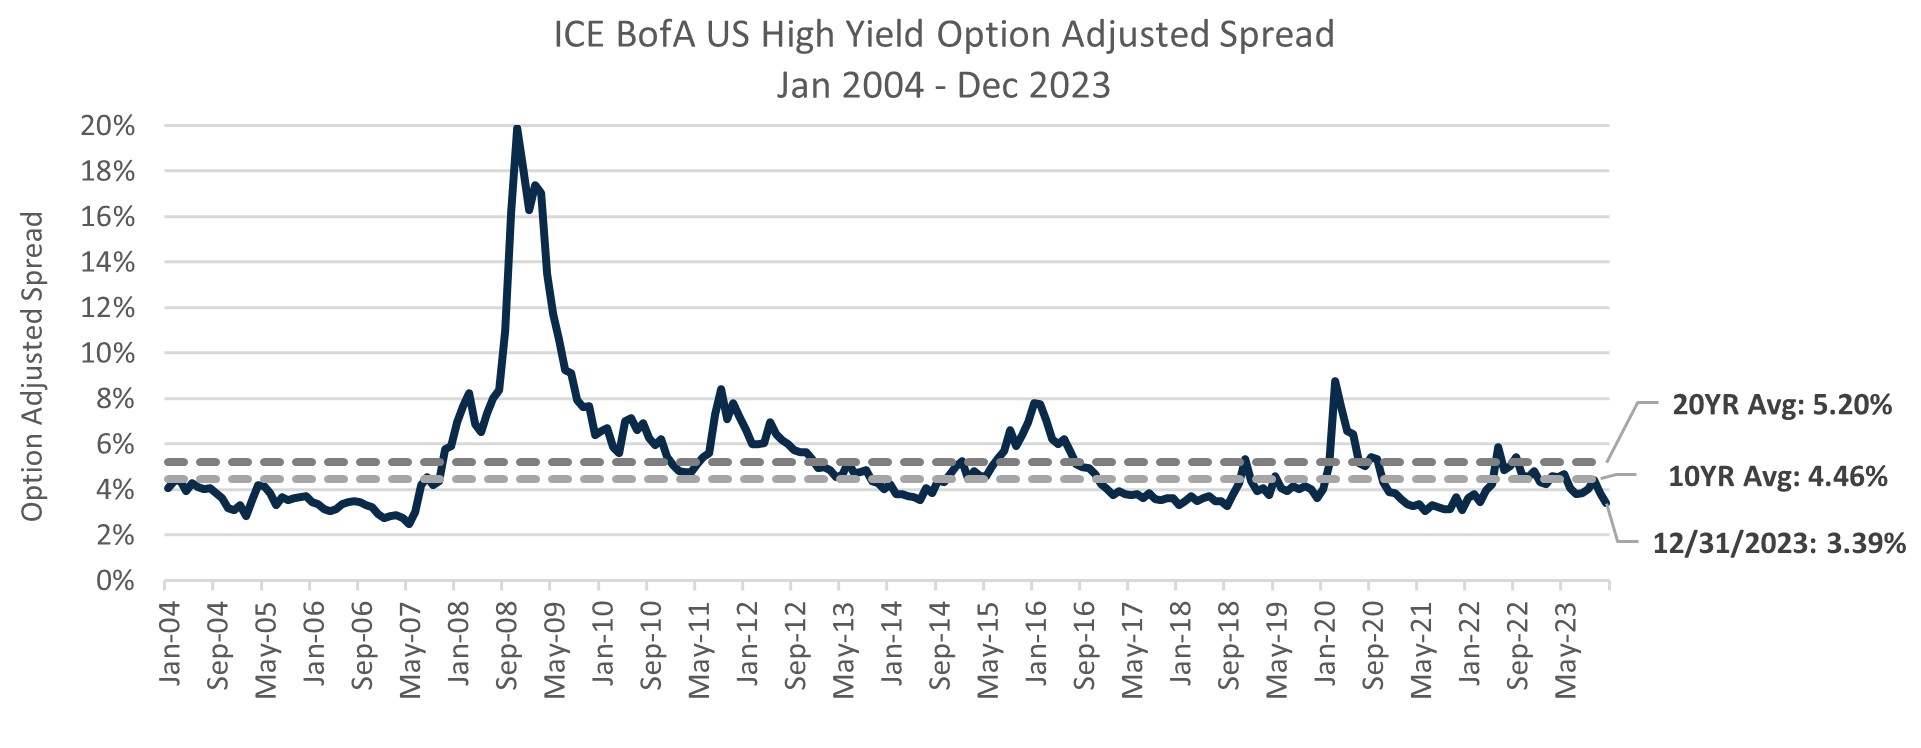
Source: FRED Economic Data.
Performance data shown represents past performance and is no guarantee of future results.
- Amidst a backdrop of moderating inflation and a resilient economy in 2023, spreads tightened more than 100 basis points from the beginning of the year, down to 3.39% as of 12/31/2023.
- Relative to historical averages, current spread levels appear tight, more than 100 basis points tighter than the trailing 10-year average and more than 180 basis points tighter to the trailing 20-year average.
- However, we have seen high-yield credit quality improve over time, primarily driven by:
- An increase in the issuance of bonds rated BB.
- Upgrades of major issues that were rated CCC.
- Reduction in leveraged buyouts (LBOs) in the leveraged finance markets.
| ICE BofA U.S. High Yield Index Credit Quality Breakdown | ||
|---|---|---|
| Credit Rating Tier | December 2007 | December 2023 |
| BB | 38.0% | 48.7% |
| B | 43.2% | 39.8% |
| CCC and lower | 18.8% | 11.5% |
Source: FRED Economic Data. Allocations are subject to change.
Source: FRED Economic Data, Morningstar Direct.
Performance data shown represents past performance and is no guarantee of future results.
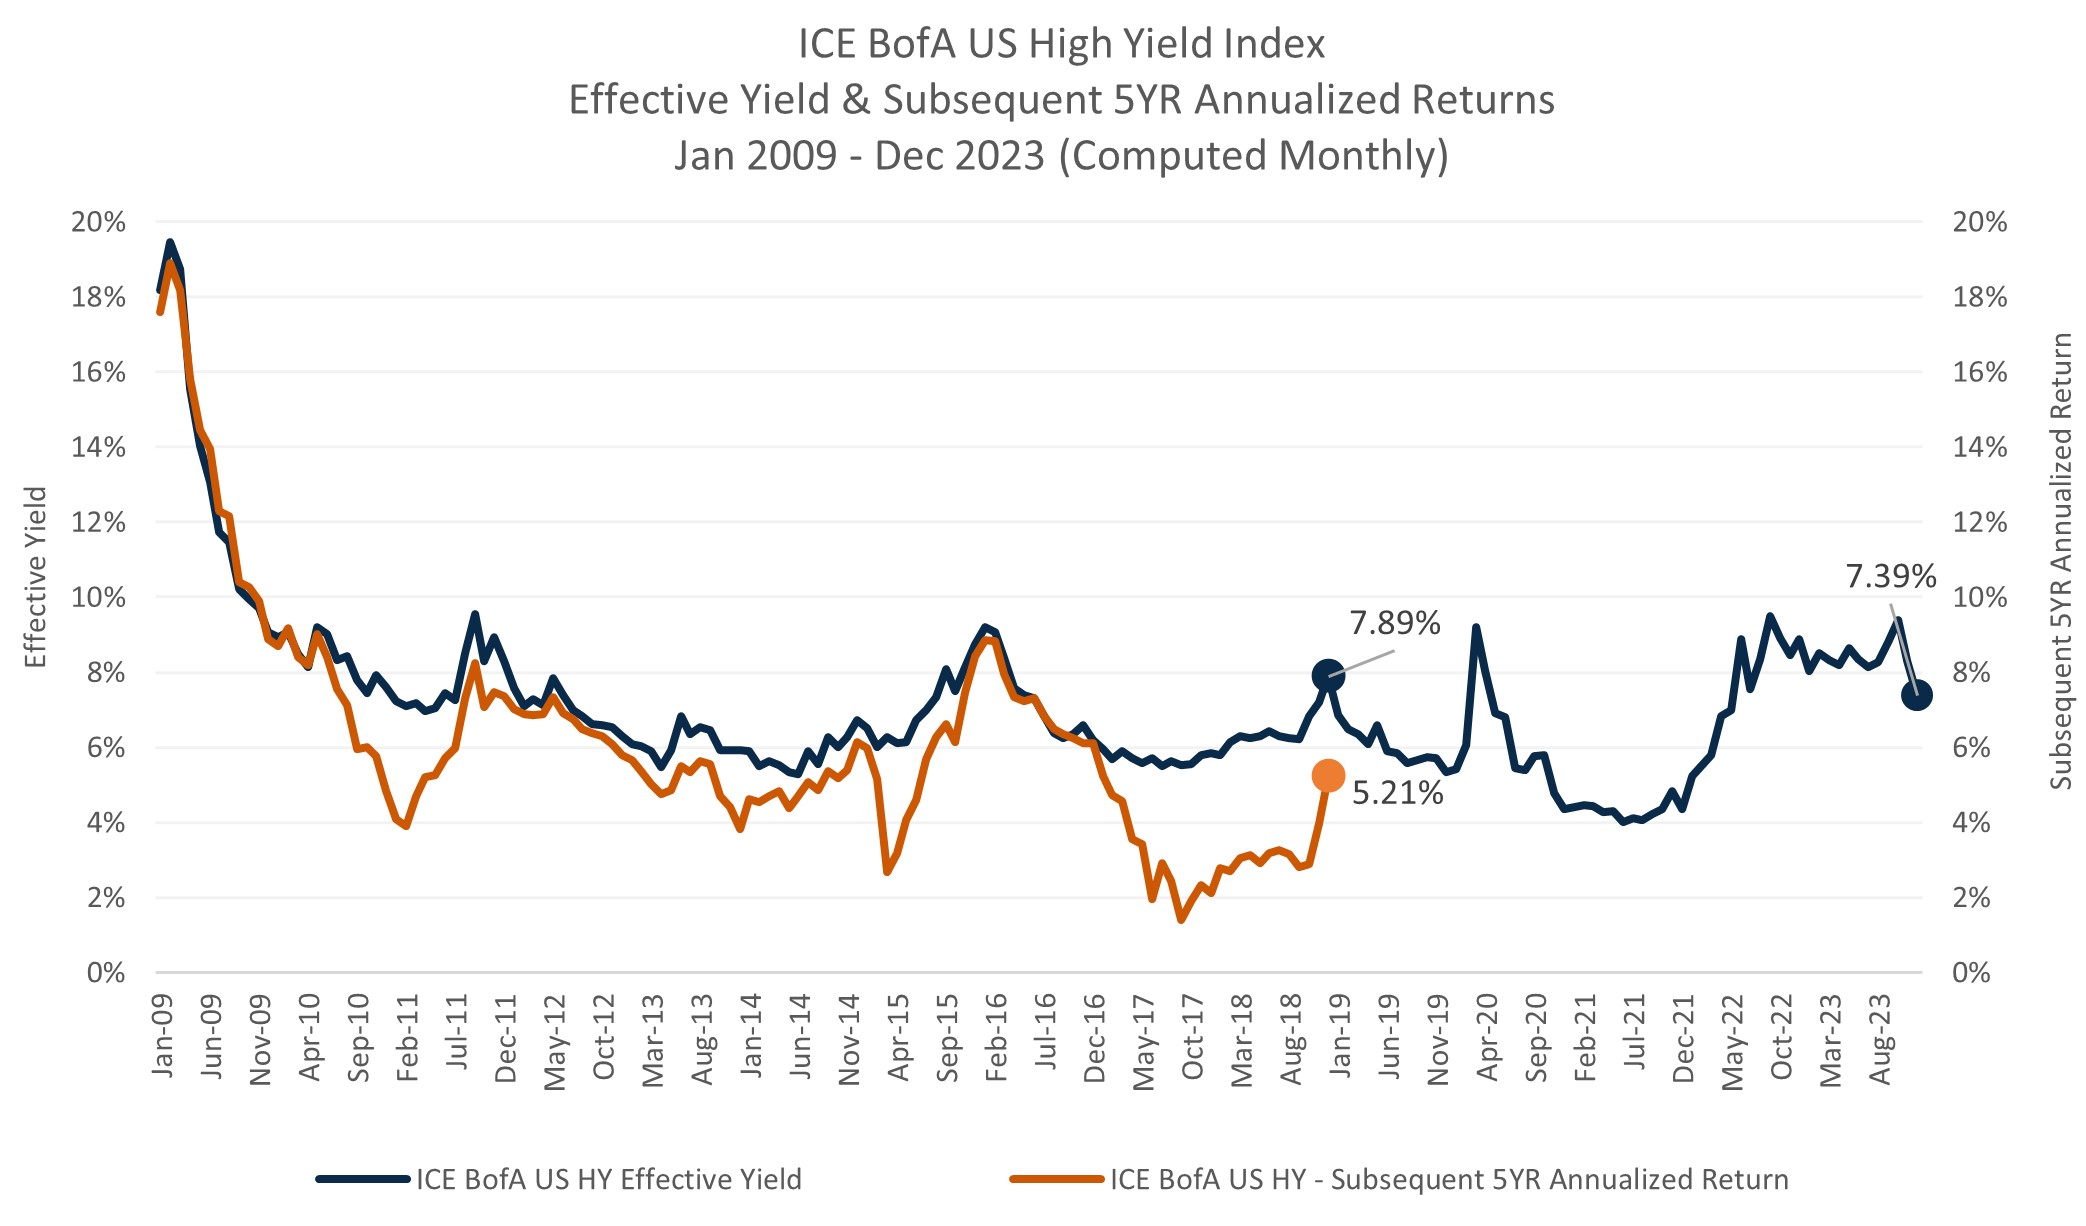
- Yields have risen such that investors are again being compensated for risk, relative to a few years ago where yields were depressed.
- Over the last 15 years, current effective yields for the ICE BofA U.S. High Yield Index have proven helpful in gauging what the benchmark’s realized returns might look like five years in the future.
- As of 12/31/2023, the yield outlook appears favorable with a current effective yield of 7.39%.
Source: FactSet, Morningstar Direct.
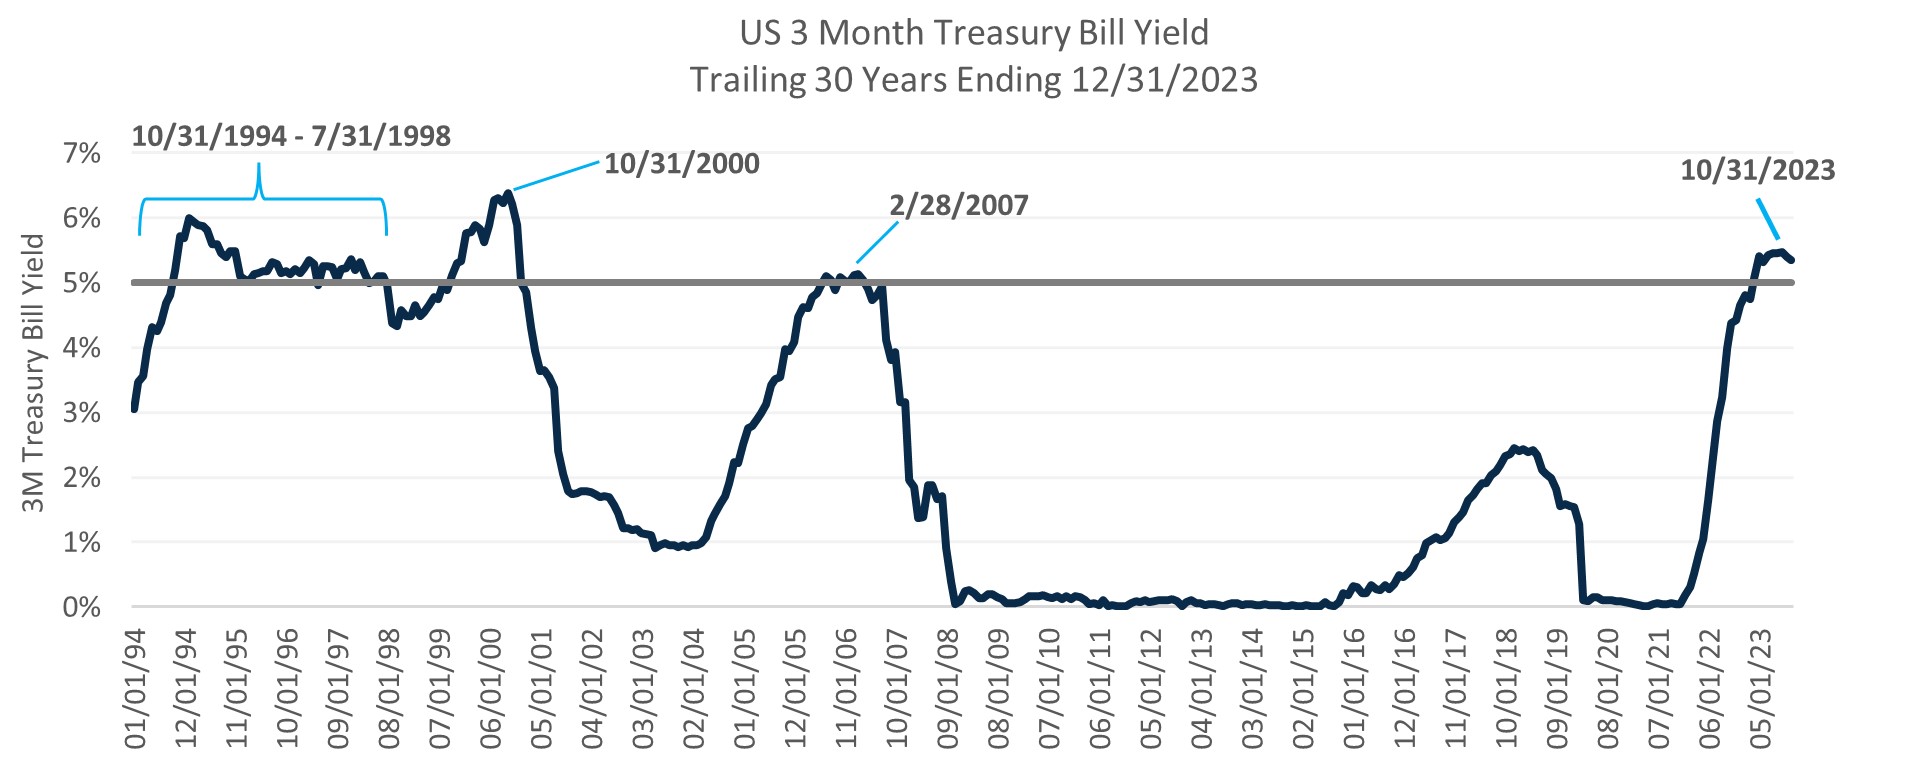
- Driven by the Fed’s historic hiking cycle, short rates rose above 5% in mid-2023, most recently peaking at 5.48% on 10/31/2023. This has driven some investors to question whether they need to take on credit risk. History may serve as a guide offering potential insight on this consideration.
- Over the last 30 years there have been three periods where the US 3 Month Treasury Bill has exceeded 5%: a prolonged period in the mid-to-late 1990’s, in late 2000 and in early 2007.
- Through the mid-to-late 1990s when short rates remained elevated above 5%, high-yield bonds delivered 786 basis points in annualized excess return.
- Following the >5% peak of short rates in late 2000 and early 2007, high-yield bonds went on to outperform in both cases over the subsequent three- and five-year periods.
- These periods highlight the benefits of compounding spread and high yield’s ability to outperform whether short rates remain elevated (late 1990s) or fall (in the three- and five-year periods following 2000 and 2007).
| 10/31/1994 - 7/31/1998 | |
|---|---|
| Total Return | |
| ICE BofA US 3M Treasury Bill | 5.52% |
| ICE BofA US HY Index | 13.40% |
Source: FactSet, Morningstar Direct.
| Subsequent Returns From 10/31/2000 | |||
|---|---|---|---|
| 1 YR | 3 YR | 5 YR | |
| ICE BofA US 3M Treasury Bill | 5.17% | 2.75% | 2.43% |
| ICE BofA US HY Index | 0.05% | 7.58% | 7.73% |
Source: FactSet, Morningstar Direct. As of March 2024.
| Subsequent Returns From 2/28/2007 | |||
|---|---|---|---|
| 1 YR | 3 YR | 5 YR | |
| ICE BofA US 3M Treasury Bill | 4.85% | 2.14% | 1.32% |
| ICE BofA US HY Index | -2.47% | 5.54% | 7.87% |
Source: FactSet, Morningstar Direct. As of March 2024.
Performance data shown represents past performance and is no guarantee of future results.
Source: FactSet, Morningstar Direct.
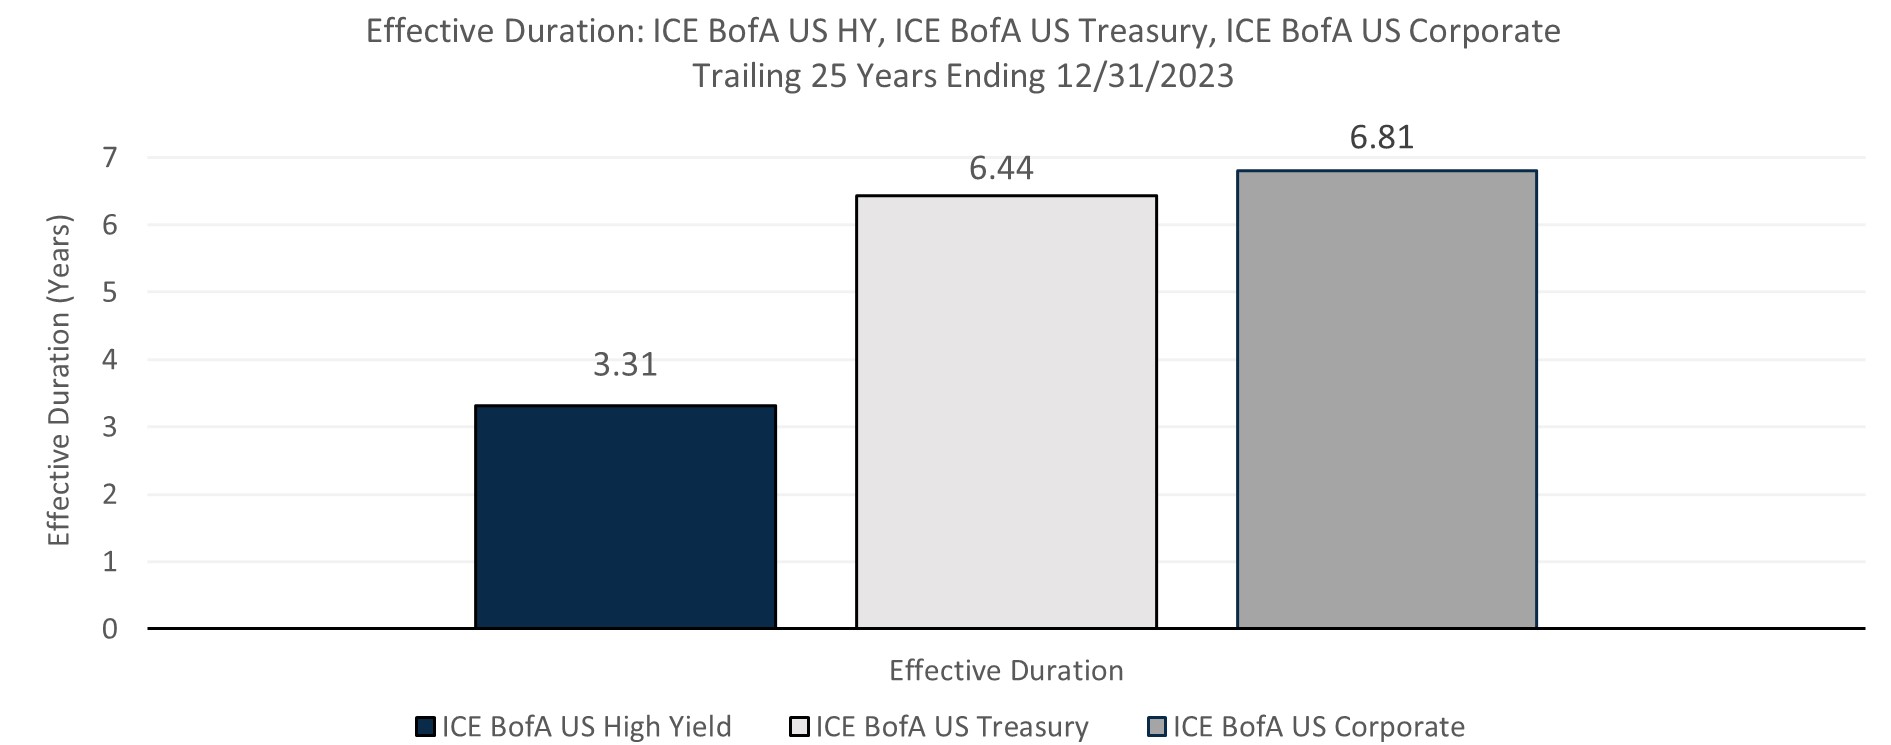
- High-yield bonds have relatively low duration compared to other fixed income asset classes and tend to be more sensitive to corporate earnings and economic conditions.
- As duration risk has hurt investors over the last few years, the lower duration profile of high-yield bonds can potentially aid in diversifying investor portfolios.
- High-yield bonds have a history of offering annualized returns closer to that of equities than other fixed income asset classes, while exhibiting lower risk (standard deviation).
- As a result, high-yield bonds may be an attractive potential equity replacement for investors looking to reduce risk in the current environment.
| Return & Risk: Trailing 25 Years Ending 12/31/2023 | ||||
|---|---|---|---|---|
| Annualized Return | Annualized Std Dev | Sharpe Ratio | Correlation to ICE BofA US High Yield | |
| ICE BofA US High Yield TR USD | 6.18% | 9.07% | 0.50 | |
| S&P 500 TR USD | 7.56% | 15.38% | 0.43 | 0.69 |
| ICE BofA US Corporate TR USD | 4.74% | 6.03% | 0.49 | 0.62 |
| ICE BofA US Treasury TR USD | 3.42% | 4.77% | 0.34 | -0.04 |
Source: FactSet, Morningstar Direct.
Performance data shown represents past performance and is no guarantee of future results.
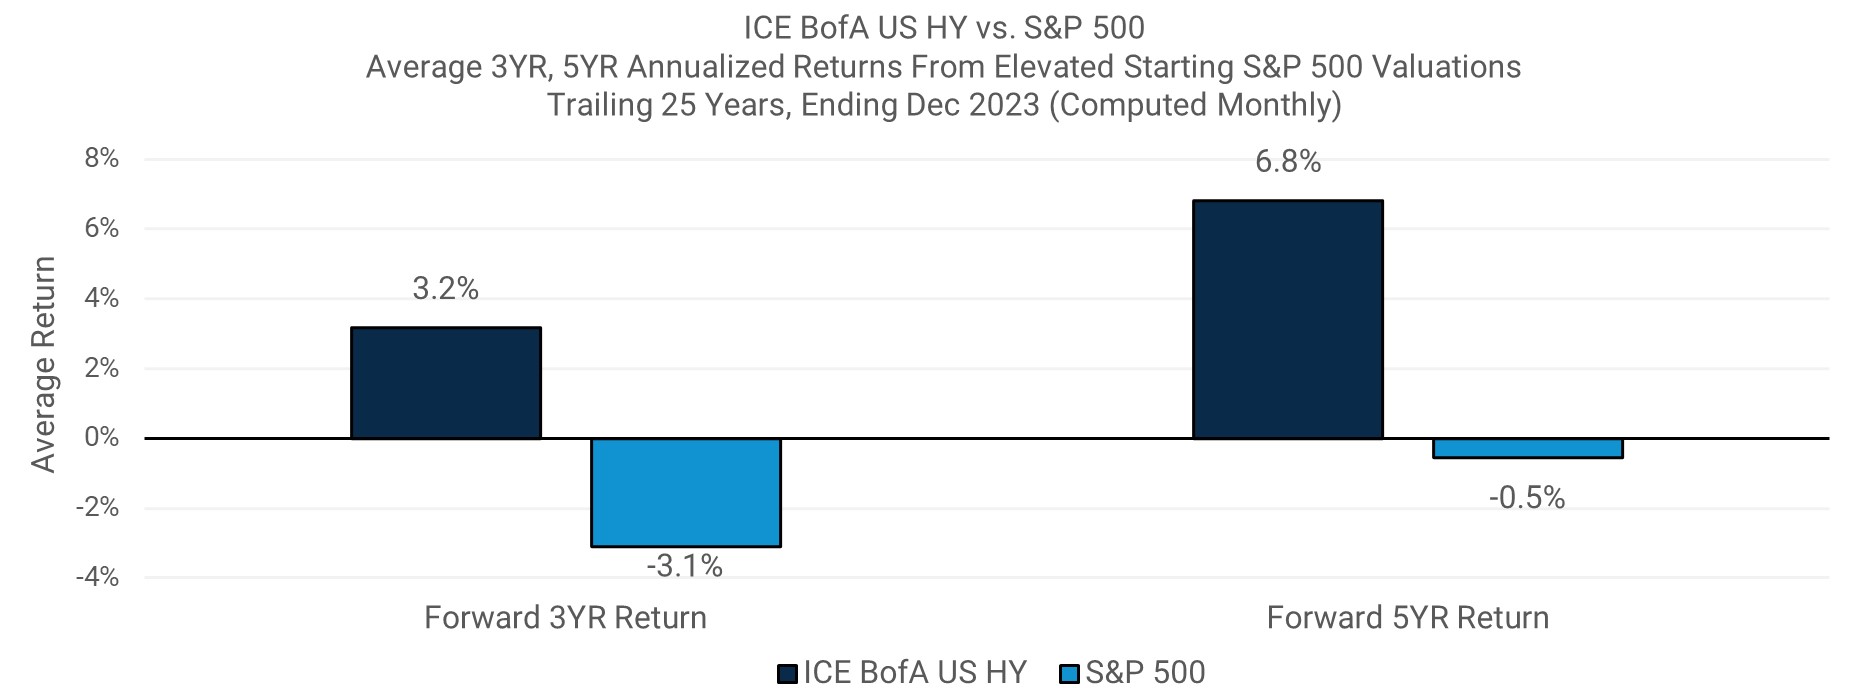
Source: Morningstar Direct, FactSet.
Performance data shown represents past performance and is no guarantee of future results.
- Over the last 25 years, high-yield bonds have performed well relative to equities following periods of elevated equity valuations.
- When starting S&P 500 valuations reside more than one standard deviation above the long-term (25 year) average, high-yield bonds have outperformed the S&P 500 in the subsequent three- and five-year periods.
- As of 12/31/2023, the FY1 P/E of the S&P 500 resided at 21.4x, elevated to both the 25-year average of 17.3x and one standard deviation above average at 20.8x.
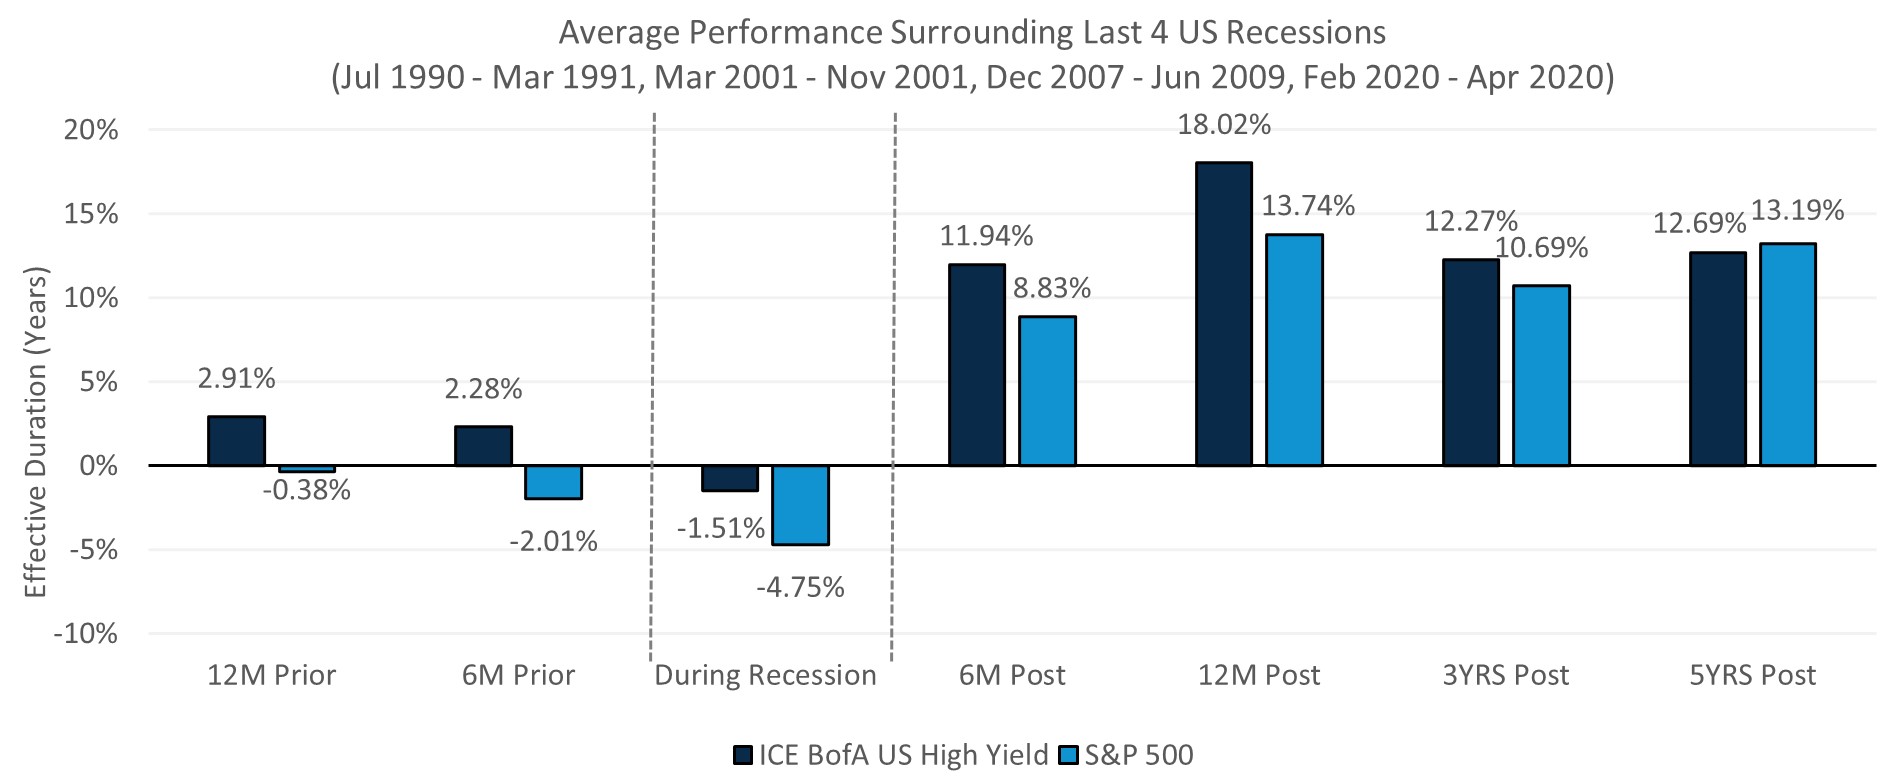
Source: Morningstar Direct, FactSet.
Performance data shown represents past performance and is no guarantee of future results.
- High-yield bonds have also delivered strong outperformance surrounding recessions in the U.S. relative to equities.
- On average, high-yield bonds have outperformed equities leading into and during recessions. Additionally, high yield has led in the immediate periods following recessions while providing similar performance in the five-year periods after recessions.
Important Information
The views expressed herein may not be reflective of current opinions, are subject to change without prior notice, and should not be considered investment advice or a recommendation to purchase or sell a particular security.
The ICE BofA US High Yield Index (H0A0) is an unmanaged index that tracks the performance of below investment grade U.S. Dollar-denominated corporate bonds publicly issued in the U.S. domestic market. All bonds are U.S. dollar denominated and rated Split BBB and below. The ICE BofA 3 Month U.S. Treasury Index measures the performance of U.S. dollar denominated U.S. Treasury Bills publicly issued in the U.S. domestic market with a remaining term to final maturity. The ICE BofA US Corporate Index tracks the performance of US dollar denominated investment grade rated corporate debt publicly issued in the US domestic market. The Standard & Poor’s 500 Index (S&P 500) is an unmanaged index generally representative of the U.S stock market. This unmanaged indices does not reflect fees and expenses and are not available for direct investment.
In relation to any data attributed to Morningstar, please note the following: © Morningstar 2024. All rights reserved. Use of this content requires expert knowledge. It is to be used by specialist institutions only. The information contained herein: (1) is proprietary to Morningstar and/or its content providers; (2) may not be copied, adapted or distributed; and (3) is not warranted to be accurate, complete or timely. Neither Morningstar nor its content providers are responsible for any damages or losses arising from any use of this information, except where such damages or losses cannot be limited or excluded by law in your jurisdiction. Past financial performance is no guarantee of future results.
Investing entails risks and there can be no assurance that any investment will achieve profits or avoid incurring losses.
Stock markets are volatile and equity values can decline significantly in response to adverse issuer, political, regulatory, market and economic conditions.
Fixed income investments are affected by interest rate changes, changes in the market conditions and the creditworthiness of the issues held. As interest rates rise, the values of fixed income securities held are likely to decrease and reduce the value of a portfolio. There is a greater risk of loss when investing in below- investment grade fixed income securities and unrated securities of similar credit quality (commonly referred to as “high-yield securities” or “junk bonds”). "High-yield" or "junk bond" securities are considered speculative because they have a higher risk of issuer default, are subject to greater price volatility and may be illiquid. Diversification does not assure a profit or protect against loss in a declining market.
Copyright © 2024 Harbor Capital Advisors, Inc. All rights reserved.
3467474
