 Contact
OSEA: Harbor International Compounders ETF
A Strong First Full Year and Potential Currency Tailwinds Ahead
April 30, 2024

.webp)
Average Annual Returns as of 03/31/2024
| 3 Months | YTD | 2023 | 1 Yr. | Since Fund Inception 9/7/2022 | Gross Expense Ratio | |
| Harbor International Compounders ETF (NAV) | 3.94% | 3.94% | 21.07% | 12.86% | 22.70% | 0.55% |
| Harbor International Compounders ETF (Market) | 4.47% | 4.47% | 20.89% | 13.43% | 23.13% | 0.55% |
| MSCI All Country World Ex. US Index | 4.69% | 4.69% | 15.62% | 13.26% | 17.39% | |
| Morningstar US Fund Foreign Large Growth Category | 6.53% | 6.53% | 16.09% | 12.86% | 17.06% |
Performance data shown represents past performance and is no guarantee of future results. Past performance is net of management fees and expenses and reflects reinvested dividends and distributions. Past performance reflects the beneficial effect of any expense waivers or reimbursements, without which returns would have been lower. Investment returns and principal value will fluctuate and when redeemed may be worth more or less than their original cost. Returns for periods less than one year are not annualized. Current performance may be higher or lower and is available through the most recent month end at harborcapital.com or by calling 800-422-1050.
Launched in September of 2022, the Harbor International Compounders ETF (OSEA) now has the benefit of having its first full calendar year of performance under its belt.
As seen in the chart that follows, OSEA performed well in 2023, outperforming both its benchmark, the MSCI ACWI ex US index, as well as category peers (Morningstar Foreign Large Growth) by a significant margin. OSEA also delivered strong excess returns at a lower beta profile than both the index and the category peer group, resulting in compelling risk-adjusted returns.
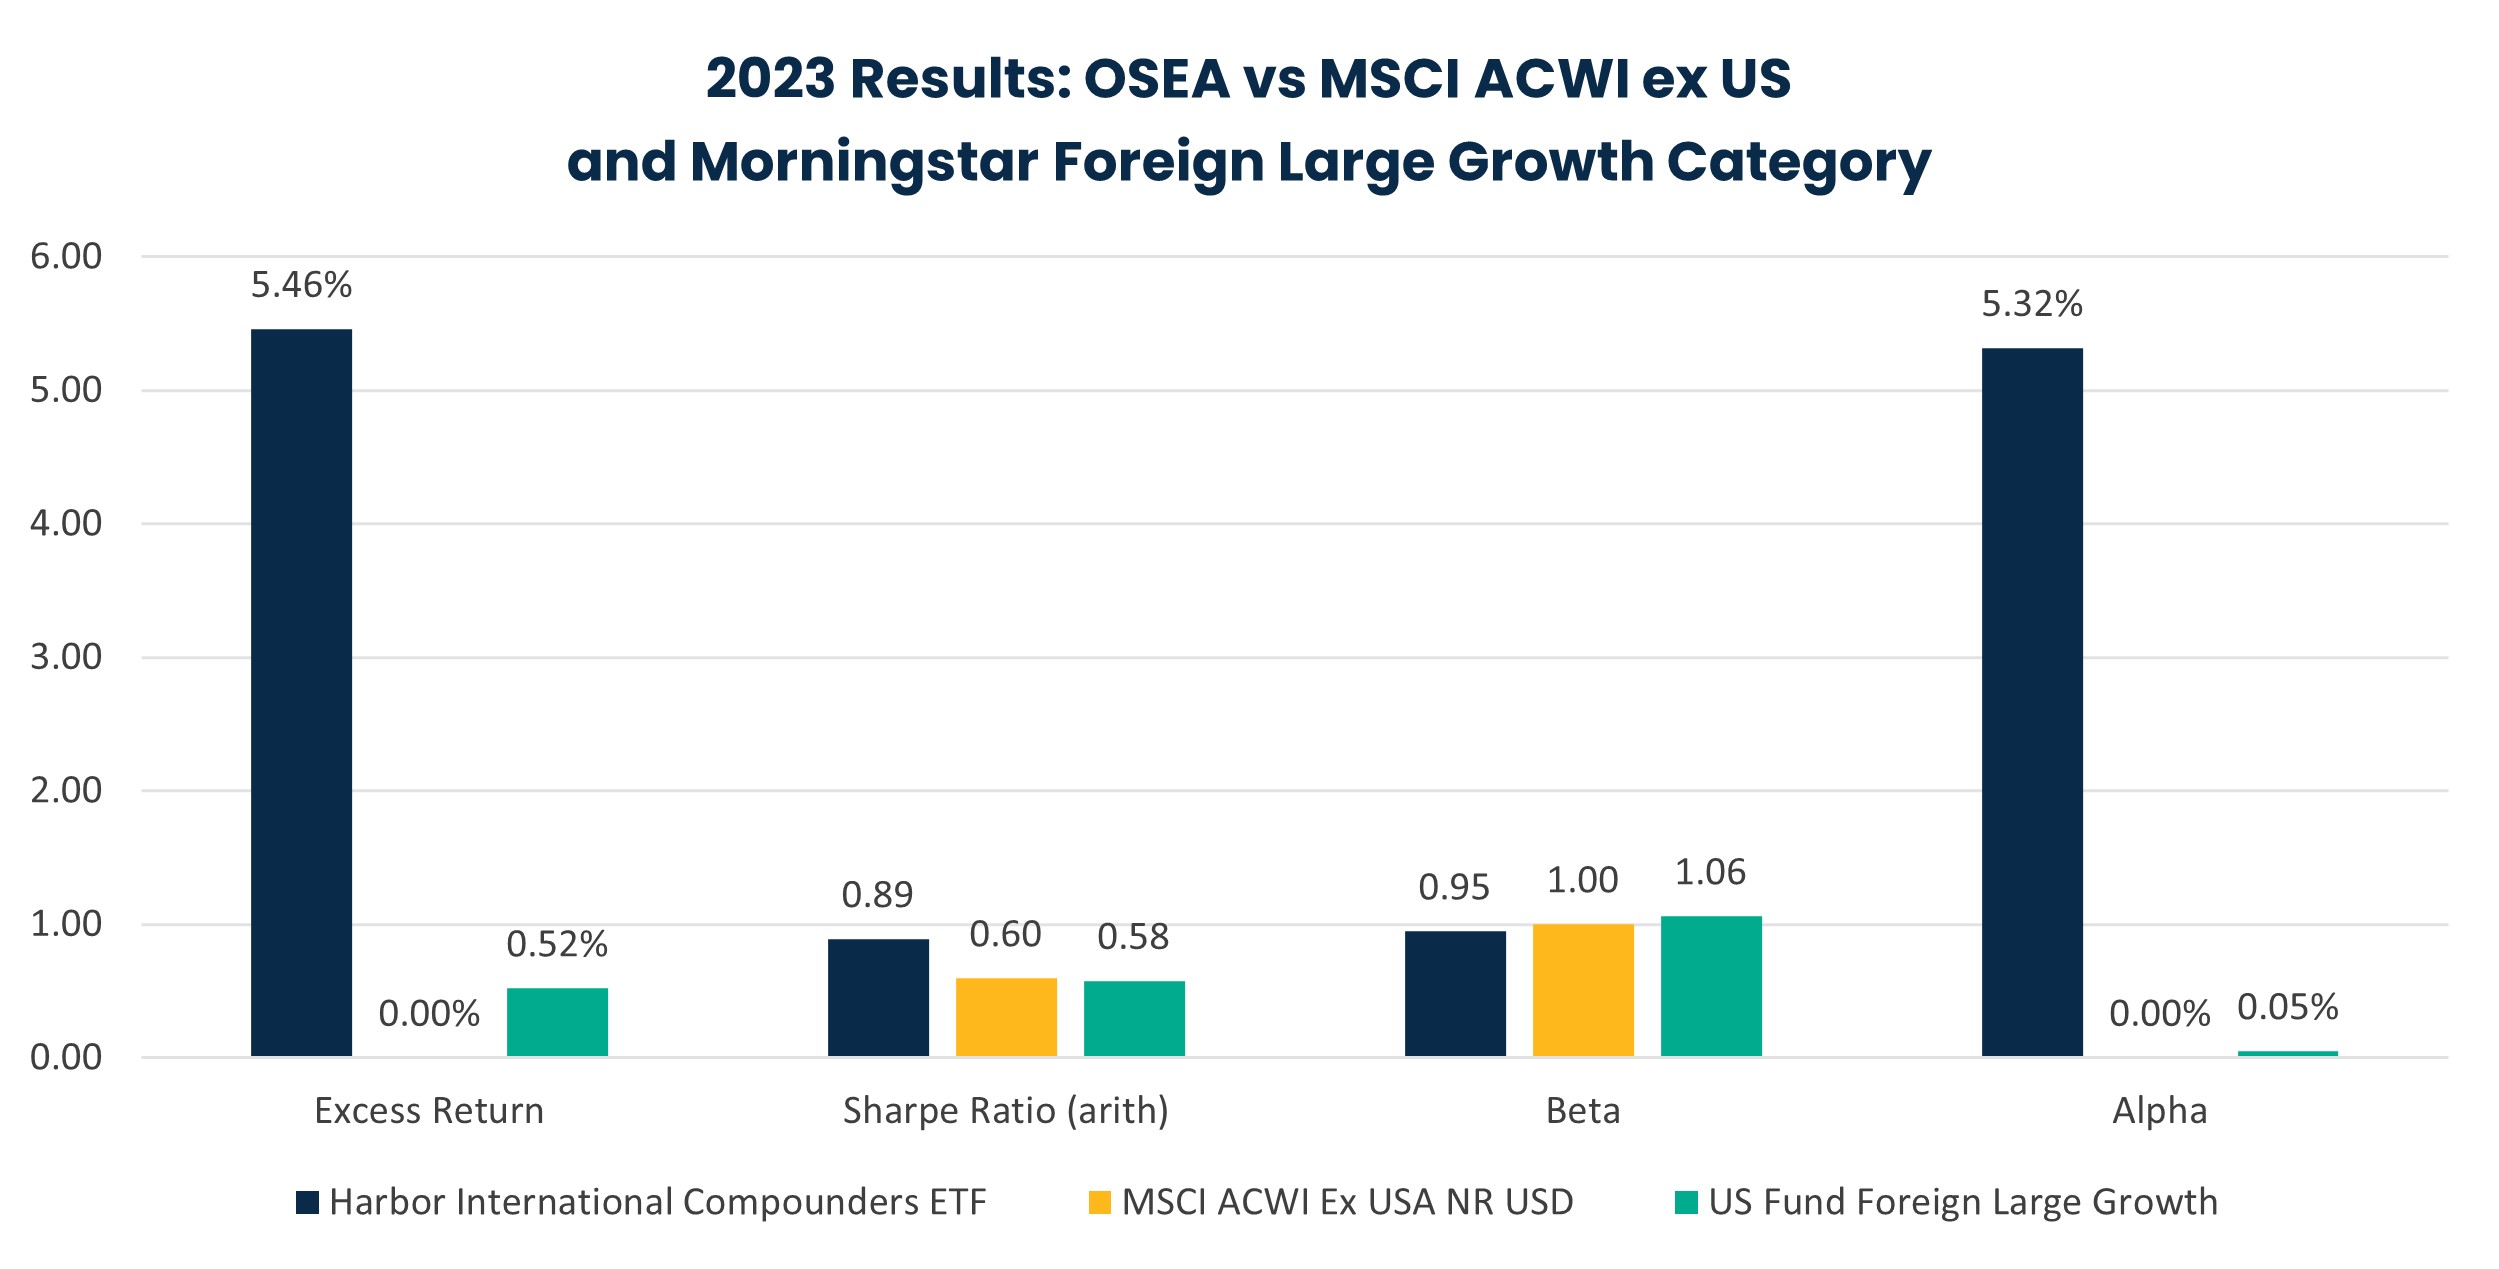
Source: Morningstar Direct as of 12/31/2023. Excess Returns for Harbor International Compounders ETF are at NAV. Performance data shown represents past performance and is no guarantee of future results. Past performance is net of management fees and expenses and reflects reinvested dividends and distributions. Past performance reflects the beneficial effect of any expense waivers or reimbursements, without which returns would have been lower. Investment returns and principal value will fluctuate and when redeemed may be worth more or less than their original cost. Returns for periods less than one year are not annualized. Current performance may be higher or lower and is available through the most recent month end at harborcapital.com or by calling 800-422-1050.
OSEA’s 2023 outperformance was also broadly dispersed from a sector standpoint relative to the benchmark as seen in the chart that follows. Specifically, OSEA generated positive allocation effects in eight of 11 economic sectors as well as positive stock selection within eight of 10 economic sectors where the fund had exposure in 2023. (No communications services exposure).
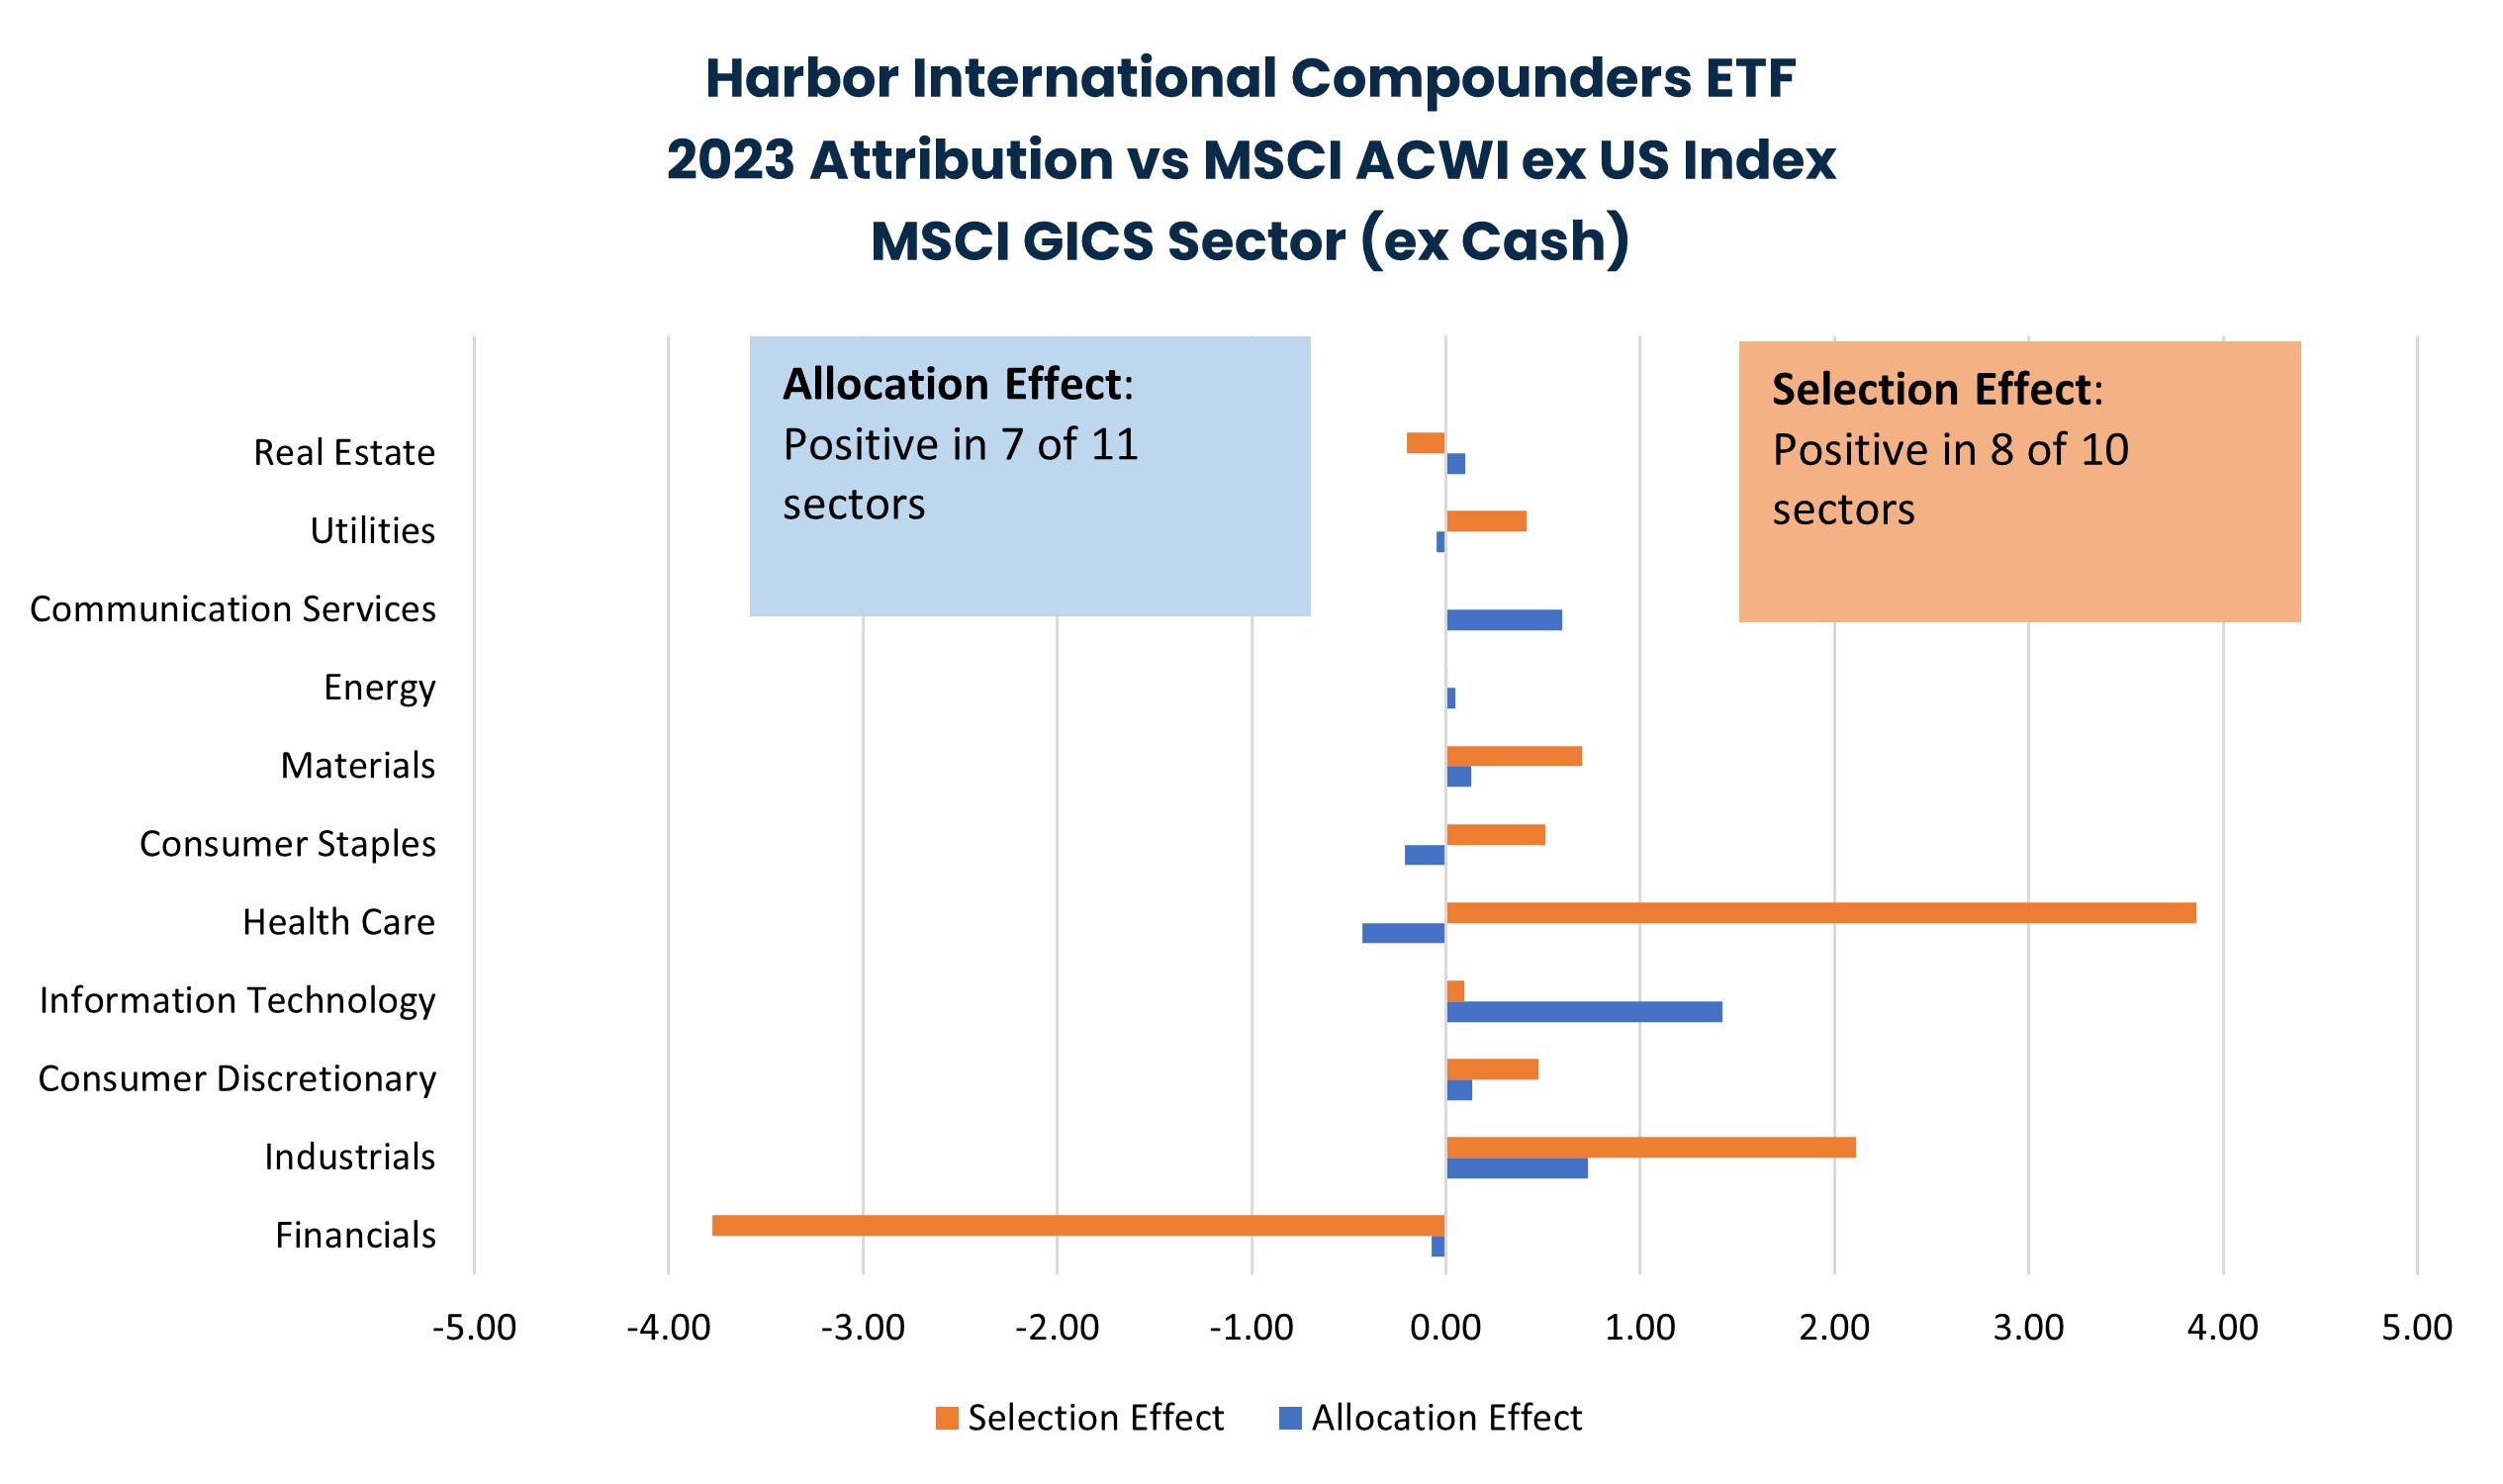
Source: FactSet Research Systems as of 12/31/2023. Performance data shown represents past performance and is no guarantee of future results.
| Over the long term we would expect that C WorldWide’s bottom-up fundamental process will result in the majority of its excess return coming from stock selection over time. However, given C WorldWide’s unique incorporation of themes into their investment process, alpha may also be generated through allocation effects, as experienced in 2023. |

| Specifically, themes play an important, independent role within OSEA’s investment process and guide the investment team in identifying addressable markets for research and idea generation. C WorldWide’s incorporation of themes is also distinct in that they think about portfolio construction as diversifying across themes rather than across sectors or geographies, which is commonly how peers construct portfolios. |

Looking ahead, we would expect C WorldWide to continue executing on their process of identifying sustainable growth companies that can compound returns for shareholders over the long term.
In addition, a shift in the Federal Reserve’s tone regarding inflation, as well as possibly signaling multiple rate cuts in 2024, could lead to U.S. dollar weakness relative to other developed market currencies. In our view, this could serve as a tailwind for non-U.S. equity returns denominated in USD looking ahead. Specifically, the chart that follows shows how the Fed was approximately four months ahead of the European Central Bank (ECB) in initially raising short-term interest rates to combat inflation in 2022.
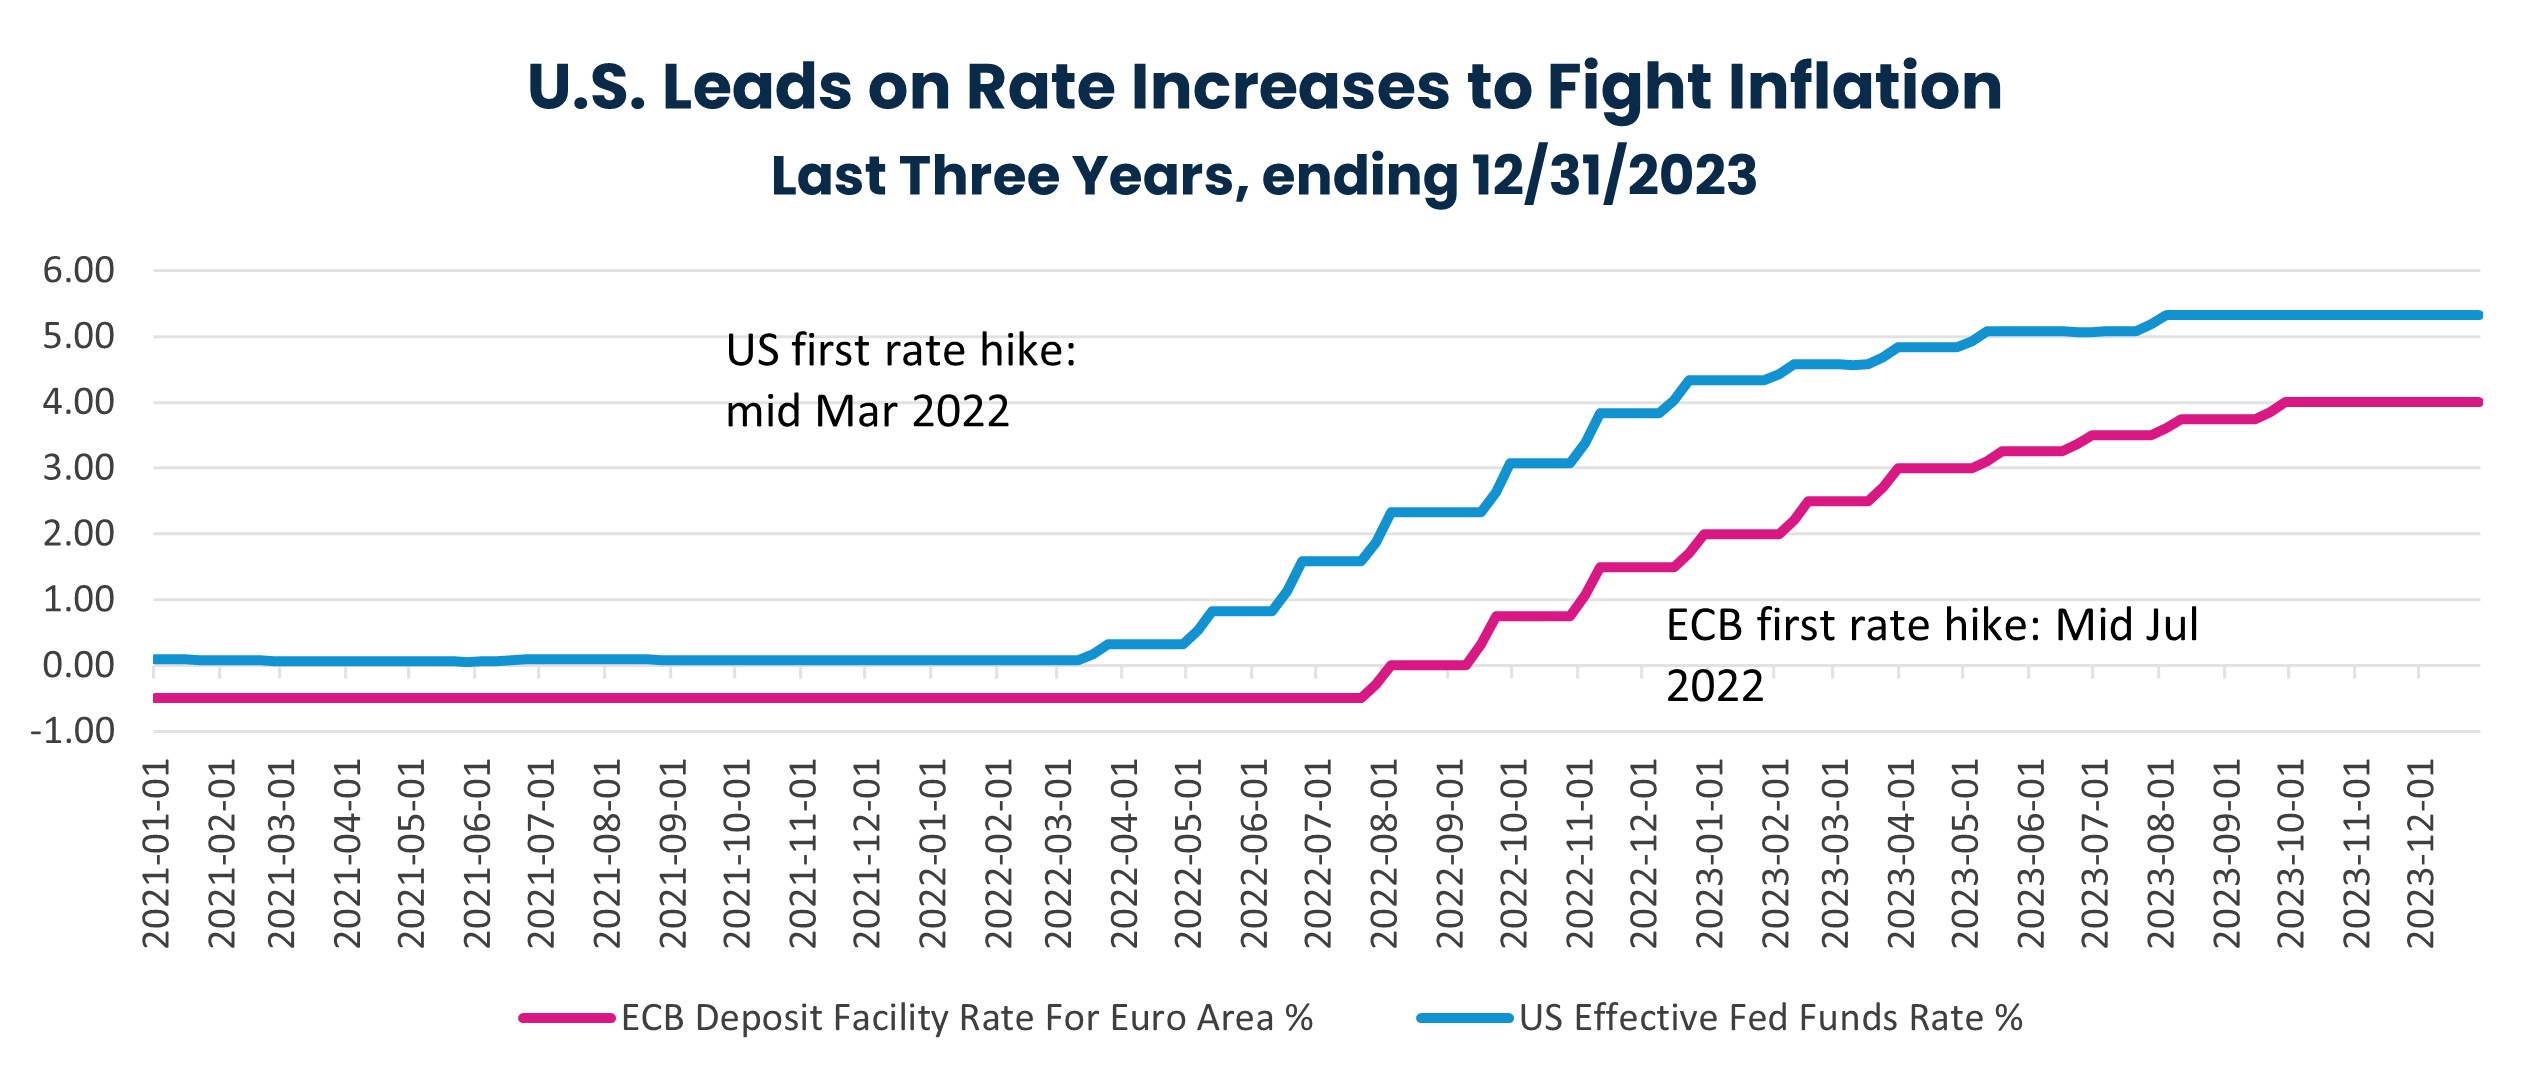
Source: Federal Reserve Bank of New York, fred.stlouisfed.org
The impact of this head start can be seen by looking at the US Dollar Index chart below, which appreciated meaningfully in mid 2022 as investors were attracted to the U.S.’s higher relative rates compared to developed markets contained within the index (Euro, Japanese Yen, UK Pound, Canadian Dollar, Swedish Krona, and Swiss Franc).
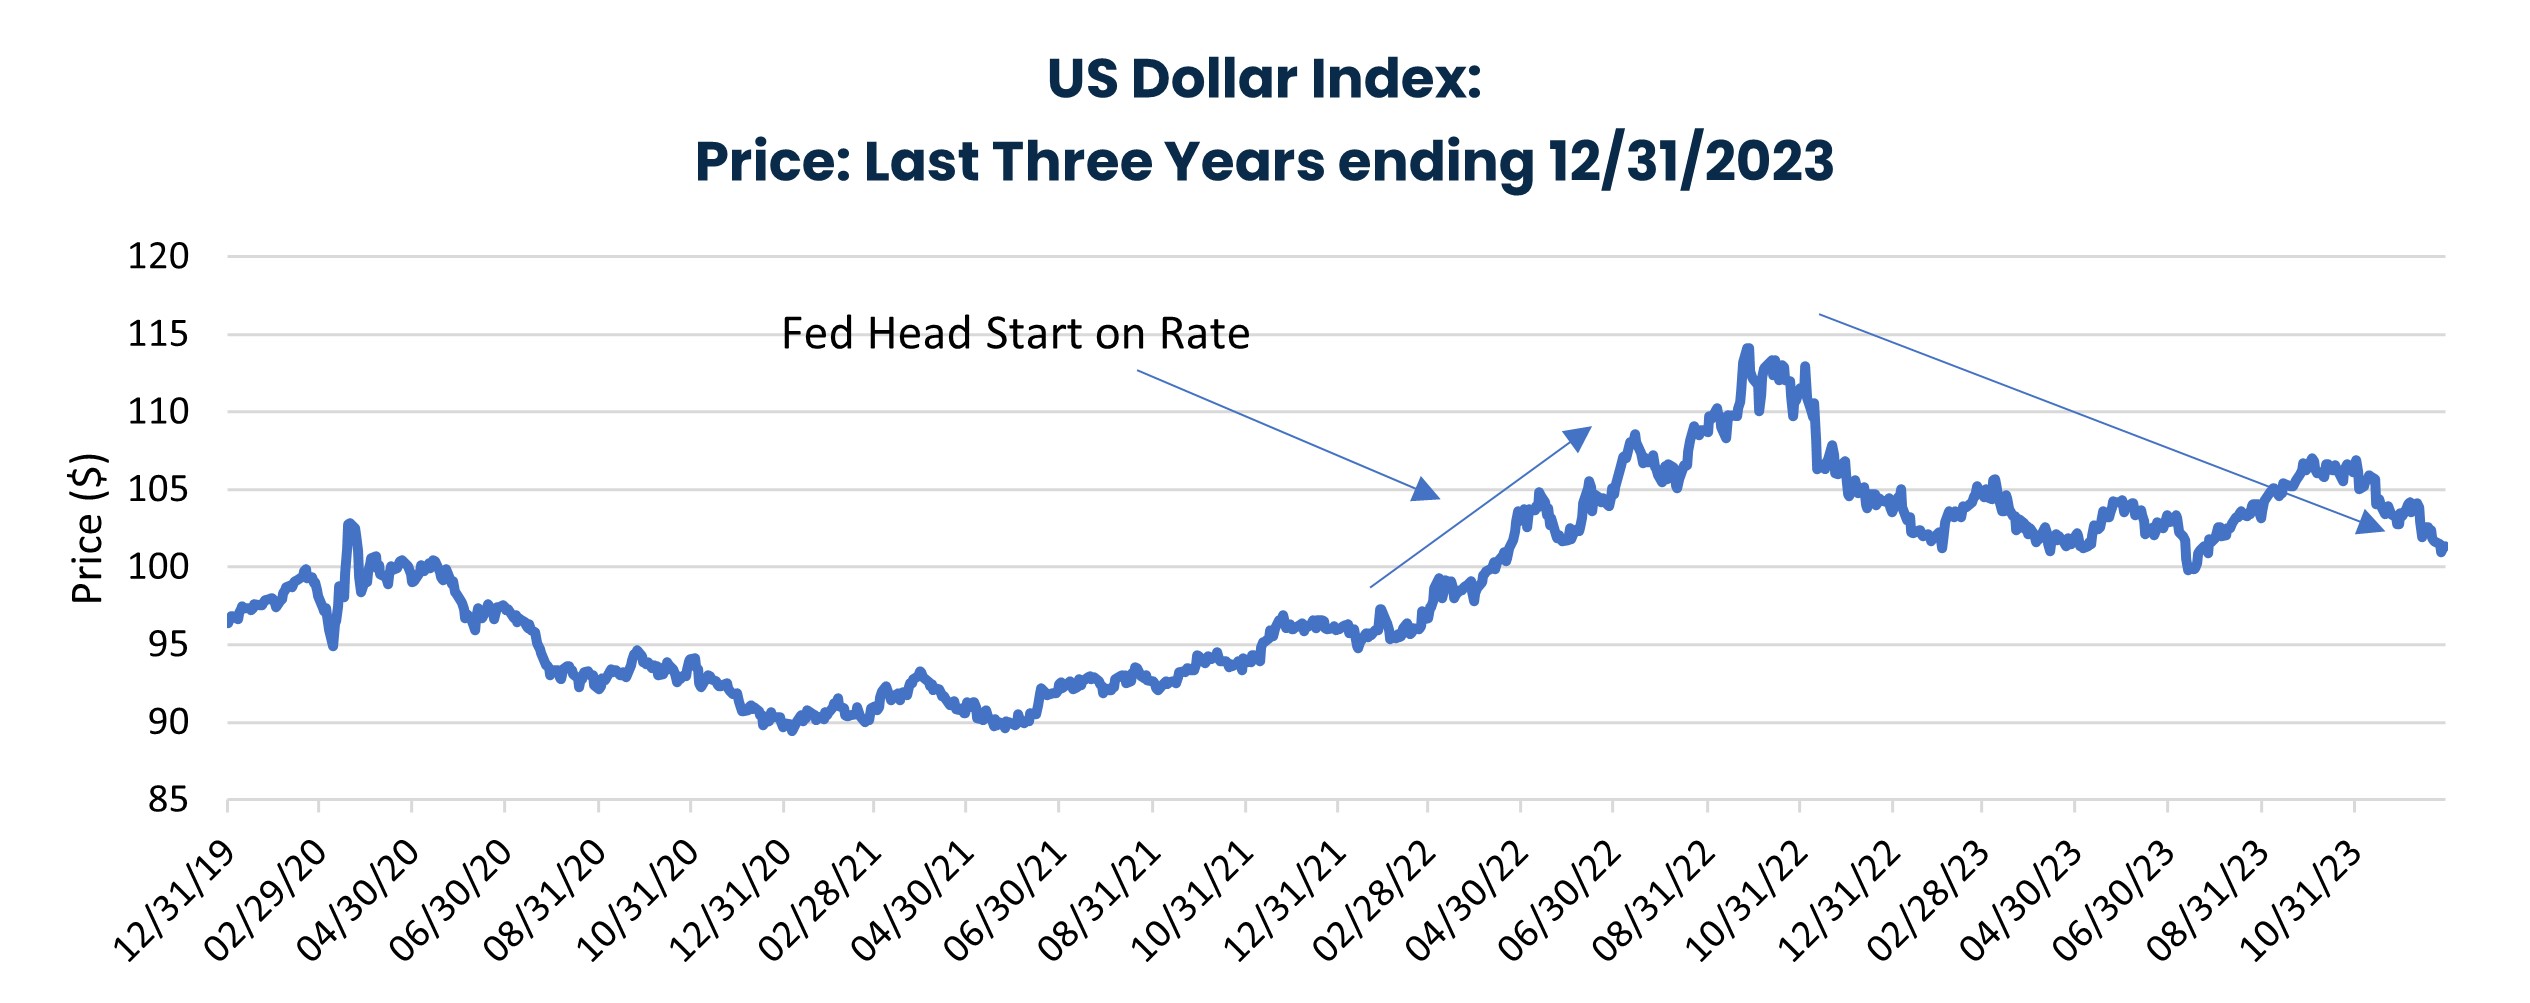
Source: FactSet Research Systems. Performance data shown represents past performance and is no guarantee of future results.
| Since its September 2022 peak, the US Dollar index has moderated somewhat. That said, at the end of 2023 it was still 13.97% above its 20-year average level. If the Fed follows through and cuts the federal funds rate in 2024 ahead of other central banks, this could result in further dollar weakness, which would serve as a tailwind to non-US equity returns denominated in US looking ahead. |

Click the following link to be redirected to OSEA’s product page to find out more about this distinct international offering. In addition, feel free to reach out to a Harbor representative to learn more about OSEA and other products by visiting our Contact Page.
Important Information
For Institutional Use Only – Not For Distribution to the Public.
All investments involve risk including the possible loss of principal. Unlike mutual funds, ETFs may trade at a premium or discount to their net asset value. The ETF is new and has limited operating history to judge.
There is no guarantee that the investment objective of the Fund will be achieved. Stock markets are volatile and equity values can decline significantly in response to adverse issuer, political, regulatory, market and economic conditions. Investing in international and emerging markets poses special risks, including potentially greater price volatility due to social, political and economic factors, as well as currency exchange rate fluctuations. These risks are more severe for securities of issuers in emerging market regions. A non-diversified Fund may invest a greater percentage of its assets in securities of a single issuer, and/or invest in a relatively small number of issuers, it is more susceptible to risks associated with a single economic, political or regulatory occurrence than a more diversified portfolio.
Shares are bought and sold at market price not net asset value (NAV). Market price returns are based upon the closing composite market price and do not represent the returns you would receive if you traded shares at other times.
The MSCI All Country World Ex. US (ND) Index is a free float-adjusted market capitalization weighted index that is designed to measure equity market performance in the global developed and emerging markets, excluding the U.S. This unmanaged index does not reflect fees and expenses and is not available for direct investment.
The Sharpe Ratio is a risk-adjusted measure of return which uses standard deviation to represent risk.
Beta is a measure of systematic risk, or the sensitivity of a fund to movements in the benchmark. A beta of 1 implies that the expected movement of a fund's return would match that of the benchmark used to measure beta.
Alpha is a measure of risk (beta)-adjusted return.
C WorldWide Asset Management is a third-party subadvisor to the Harbor International Compounders ETF
The views expressed herein may not be reflective of current opinions, are subject to change without prior notice, and should not be considered investment advice.
3532808


