 Contact
U.S. Large Cap Growth Equities
Opportunities & Considerations for 2024 & Beyond
February 09, 2024Earnings Per Share (FactSet Recurrent Earnings) & Price
Jun 1990 - Dec 2023 (Quarterly)
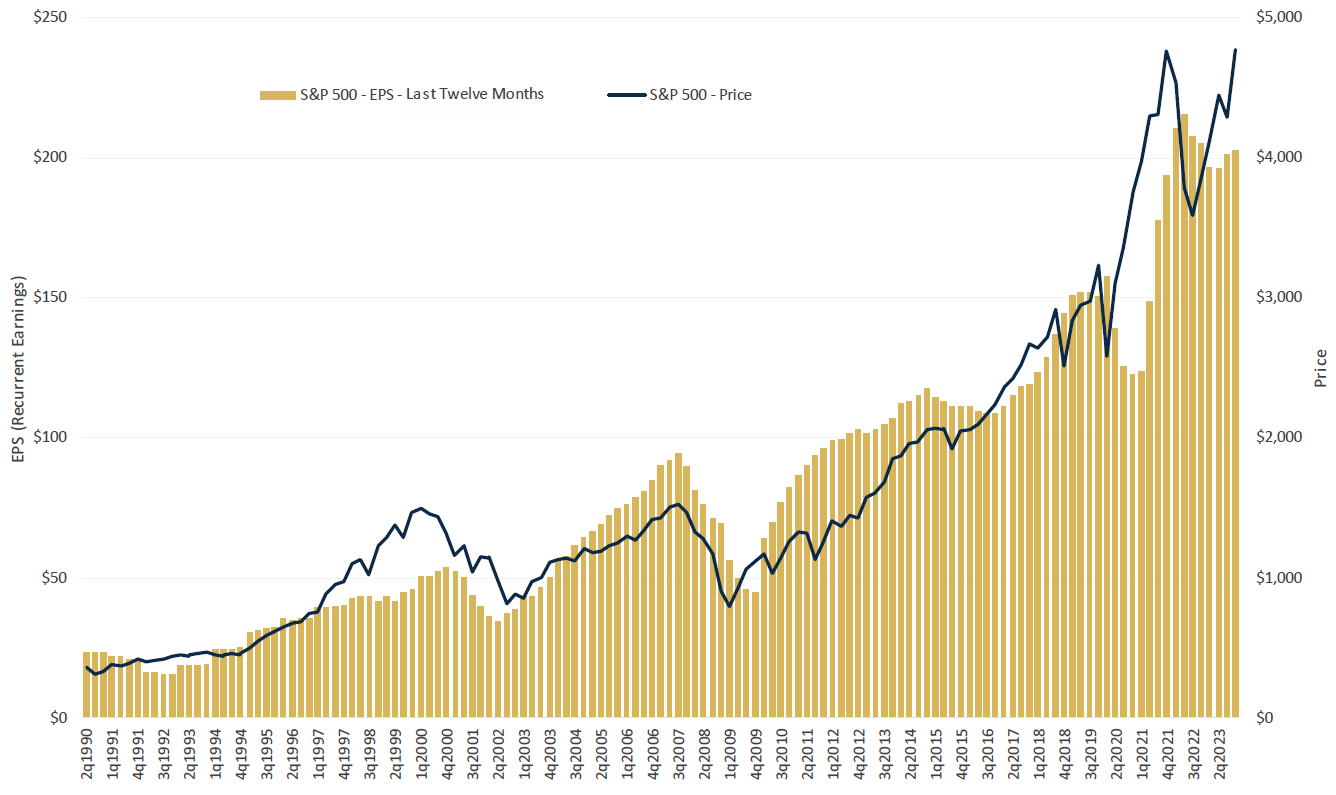
- Short-term market shifts can become disconnected from company fundamentals. However, the chart to the right shows that over the long-term, stock prices have followed growth in earnings per share.
- Companies that create economic value through long-duration competitive advantages historically possess the potential to generate strong growth in earnings and cash flows and deliver excess returns over longer term horizons.
Source: FactSet Research Systems. Performance data shown represents past performance and is no guarantee of future results.
Cumulative Exess Return: 12 Months Prior to 12 Months Post Recession End Dates 1980-2023
Recession End Dates: Jul 1980, Nov 1982, Mar 1991, Nov 2001, Jun 2009, Apr 2020
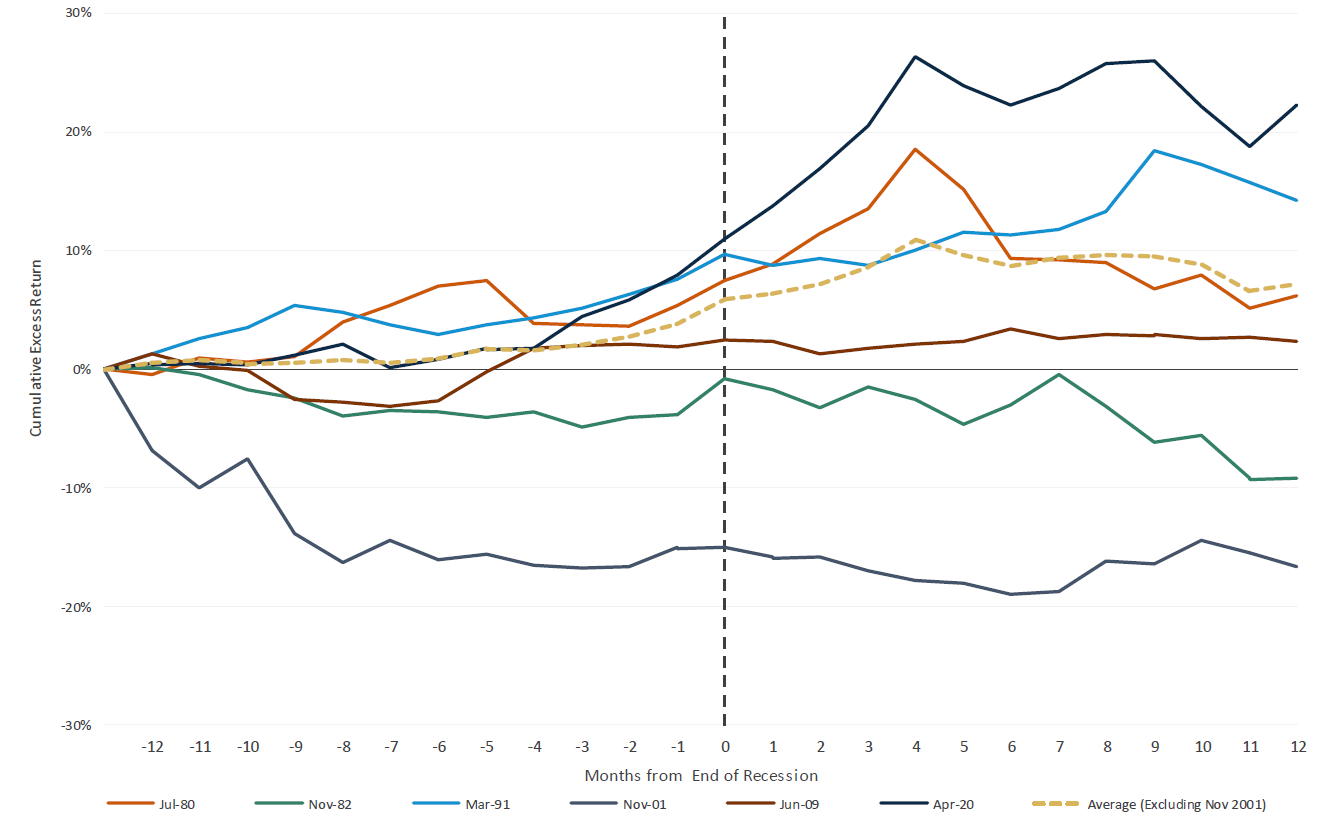
- The Russell 1000 Growth Index has outperformed broad market equities in 12-month prior through 12-month post recession end date periods in four of the last six U.S. recessions since 1980.
- Excluding 2001’s dot-com recession, the Russell 1000 Growth Index has averaged a +7.2% excess return versus the S&P 500 Index in these periods.
- Looking ahead, U.S. large cap growth equities enable solid exposure to secular growth markets well positioned to
withstand pressure from tighter financial conditions such as:
- Artificial Intelligence
- Health Care Innovation
- Transformational Mobility
- Industrial Automation
- Emerging Fintech Platforms
Source: FactSet Research Systems. Performance data shown represents past performance and is no guarantee of future results.
Jan 2004 - Dec 2023 (Monthly)
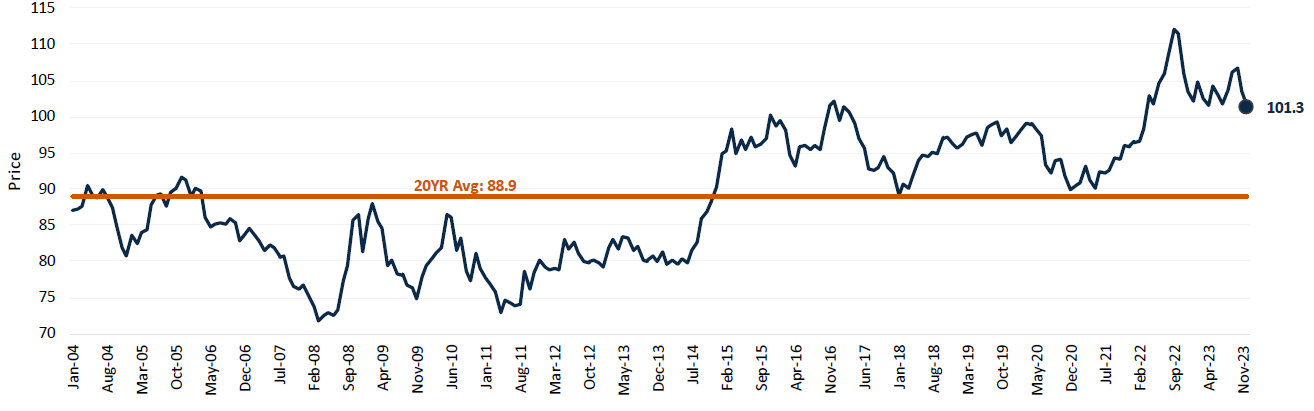
- Despite recent weakness, the U.S. Dollar Index still traded at a 14.0% premium relative to its 20-year average as of 12/31/2023.
FactSet Geographic Revenue Exposures as of 12/31/2023
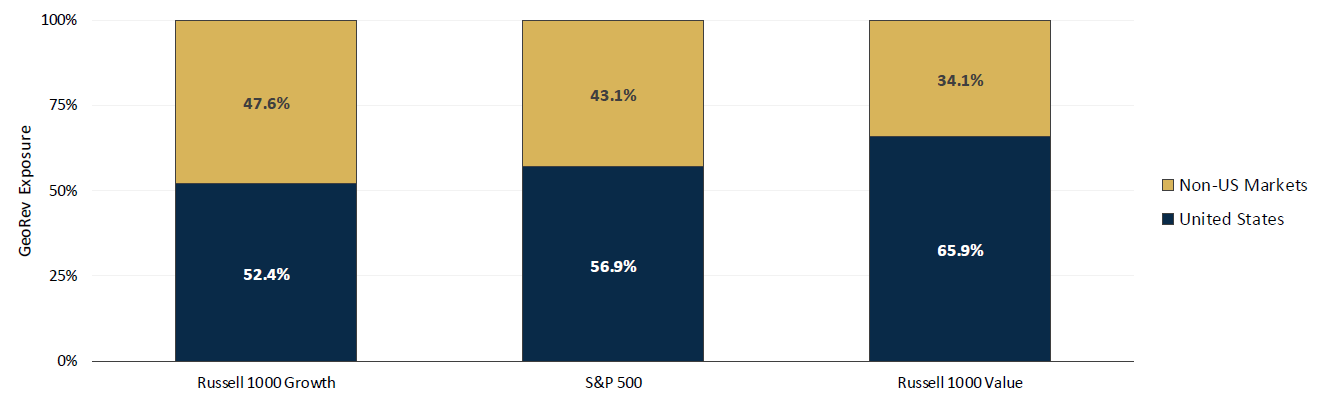
- If mean reversion were to occur moving ahead, the Russell 1000 Growth is more exposed to non-US revenue sources and could likely experience stronger benefit relative to the more domestically tilted S&P 500 and Russell 1000 Value Indices.
Source: FactSet Research Systems. Performance data shown represents past performance and is no guarantee of future results.
Top Ten Holdings Weight vs.
Subsequent 3YR Performance Ranking Within Morningstar US Large Growth Category
Dec 1993 - Dec 2023 (Quarterly)
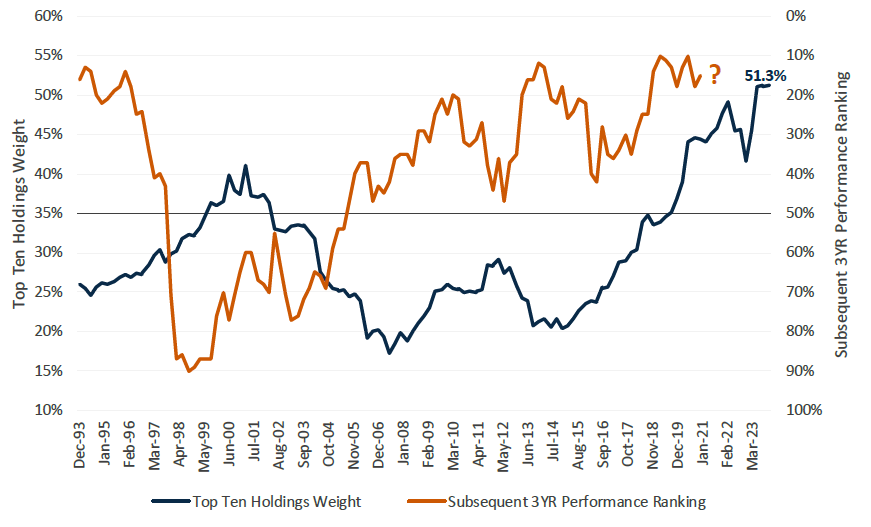
- The Russell 1000 Growth Index has become highly concentrated; its top ten holdings weight has increased from 21.6% to 51.3% over the past decade.
- Historically, past periods of less meaningful Index concentration have subsequently been followed by stronger active manager performance as these positions have unwound and managers with underweight stances have generally benefited.
vs.
Russell 1000 Growth Index: Rolling 3YR Performance Ranking
Dec 1993 - Dec 2023 (Quarterly)
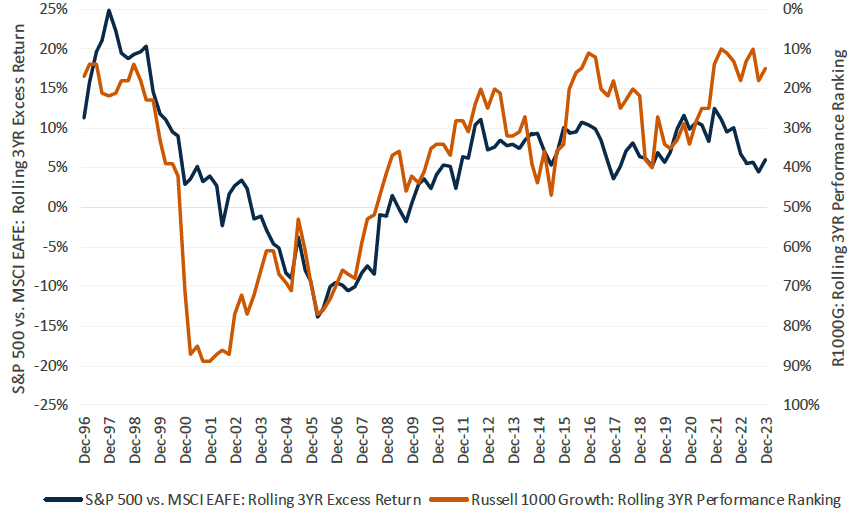
- U.S. equities have outperformed non-U.S. equities over the past decade; the S&P 500 returned 12.0% versus 4.3% for the MSCI EAFE Index over the last 10 years.
- Active U.S. large cap growth managers typically maintain exposure to non-U.S. companies with strong earnings growth potential, which has been a meaningful headwind. A potential weakening dollar and non-U.S. outperformance may provide a tailwind for active managers looking ahead.
Source: FactSet Research Systems & Morningstar Direct: Performance data shown represents past
performance and is no guarantee of future results.
The Russell 1000 Growth Index has not been
designated in a specific Morningstar category and the rankings presented are for illustrative purposes only. No
fees have been taken into consideration for the index ranking. The highest (or most favorable) percentile rank is
1 and the lowest (or least favorable) percentile rank is 100.
Important Information
The views expressed herein may not be reflective of current opinions, are subject to change without prior notice, and should not be considered investment advice or a recommendation to purchase or sell a particular security.
Past performance is no guarantee of future results.
The S&P 500 Index is an unmanaged index generally representative of the U.S. market for large capitalization equities. The Russell 1000® Growth Index is an unmanaged index generally representative of the U.S market for larger capitalization growth stocks. The Russell 1000® Value Index measures the performance of the large-cap value segment of the US equity universe. The Russell 1000® Growth Index and Russell 1000® Value Index, and Russell 2000® Growth Index and Russell® are trademarks of Frank Russell Company. The MSCI EAFE (ND) Index is an unmanaged index generally representative of major overseas stock markets. These unmanaged indices do not reflect fees and expenses and are not available for direct investment.
© Morningstar 2023. All rights reserved. Use of this content requires expert knowledge. It is to be used by specialist institutions only. The information contained herein: (1) is proprietary to Morningstar and/or its content providers; (2) may not be copied, adapted or distributed; and (3) is not warranted to be accurate, complete or timely. Neither Morningstar nor its content providers are responsible for any damages or losses arising from any use of this information, except where such damages or losses cannot be limited or excluded by law in your jurisdiction. Past financial performance is no guarantee of future results.
Earnings per share (EPS) is the portion of a company's profit allocated to each outstanding share.
Investing entails risks and there can be no assurance that any investment will achieve profits or avoid incurring losses.
Diversification does not assure a profit or protect against loss in a declining market.
Harbor Capital Advisors, Inc.
3388605


