 Contact
Harbor Long-Term Growers ETF Strategy Profile
April 23, 2024Average Annual Returns as of 03/31/2024
| 3 Months | YTD | 1 Yr. | 3 Yr. | 5 Yr. | 10 Yr. | Since Inception | Inception Date | |
| Harbor Long-Term Growers ETF (NAV) | 13.35% | 13.35% | 45.53% | N/A | N/A | N/A | 9.40% | 2/2/2022 |
| Harbor Long-Term Growers ETF (Market) | 13.55% | 13.55% | 45.69% | N/A | N/A | N/A | 9.48% | 2/2/2022 |
| Russell 1000® Growth Index | 11.41% | 11.41% | 39.00% | 12.50% | 18.52% | 15.98% | 9.41% | |
| Morningstar US Large Growth Category | 11.92% | 11.92% | 36.45% | 7.95% | 14.89% | 13.24% | 7.22% |
Performance data shown represents past performance and is no guarantee of future results. Past performance is net of management fees and expenses and reflects reinvested dividends and distributions. Past performance reflects the beneficial effect of any expense waivers or reimbursements, without which returns would have been lower. Investment returns and principal value will fluctuate and when redeemed may be worth more or less than their original cost. Returns for periods less than one year are not annualized. Current performance may be higher or lower and is available through the most recent month end at harborcapital.com or by calling 800-422-1050. The Fund's returns achieved during certain periods shown were unusual and an investor should not expect such performance to be sustained.
- Growth stocks have exhibited strong returns over the last 12 months, however, U.S. large cap growth equity funds generally faced challenges in outperforming the Russell 1000 Growth Index during the period.
- Despite a more categorically challenging alpha landscape, the Harbor Long-Term Growers ETF (ticker: WINN) outperformed the Russell 1000 Growth Index by 6.57%, ranking (based on total returns) in the 11th percentile of Morningstar's US Large Growth category over the 1-year period as of 3/31/2024.
Cumulative Excess Return: 4/1/2023 -3/31/2024 (Daily)
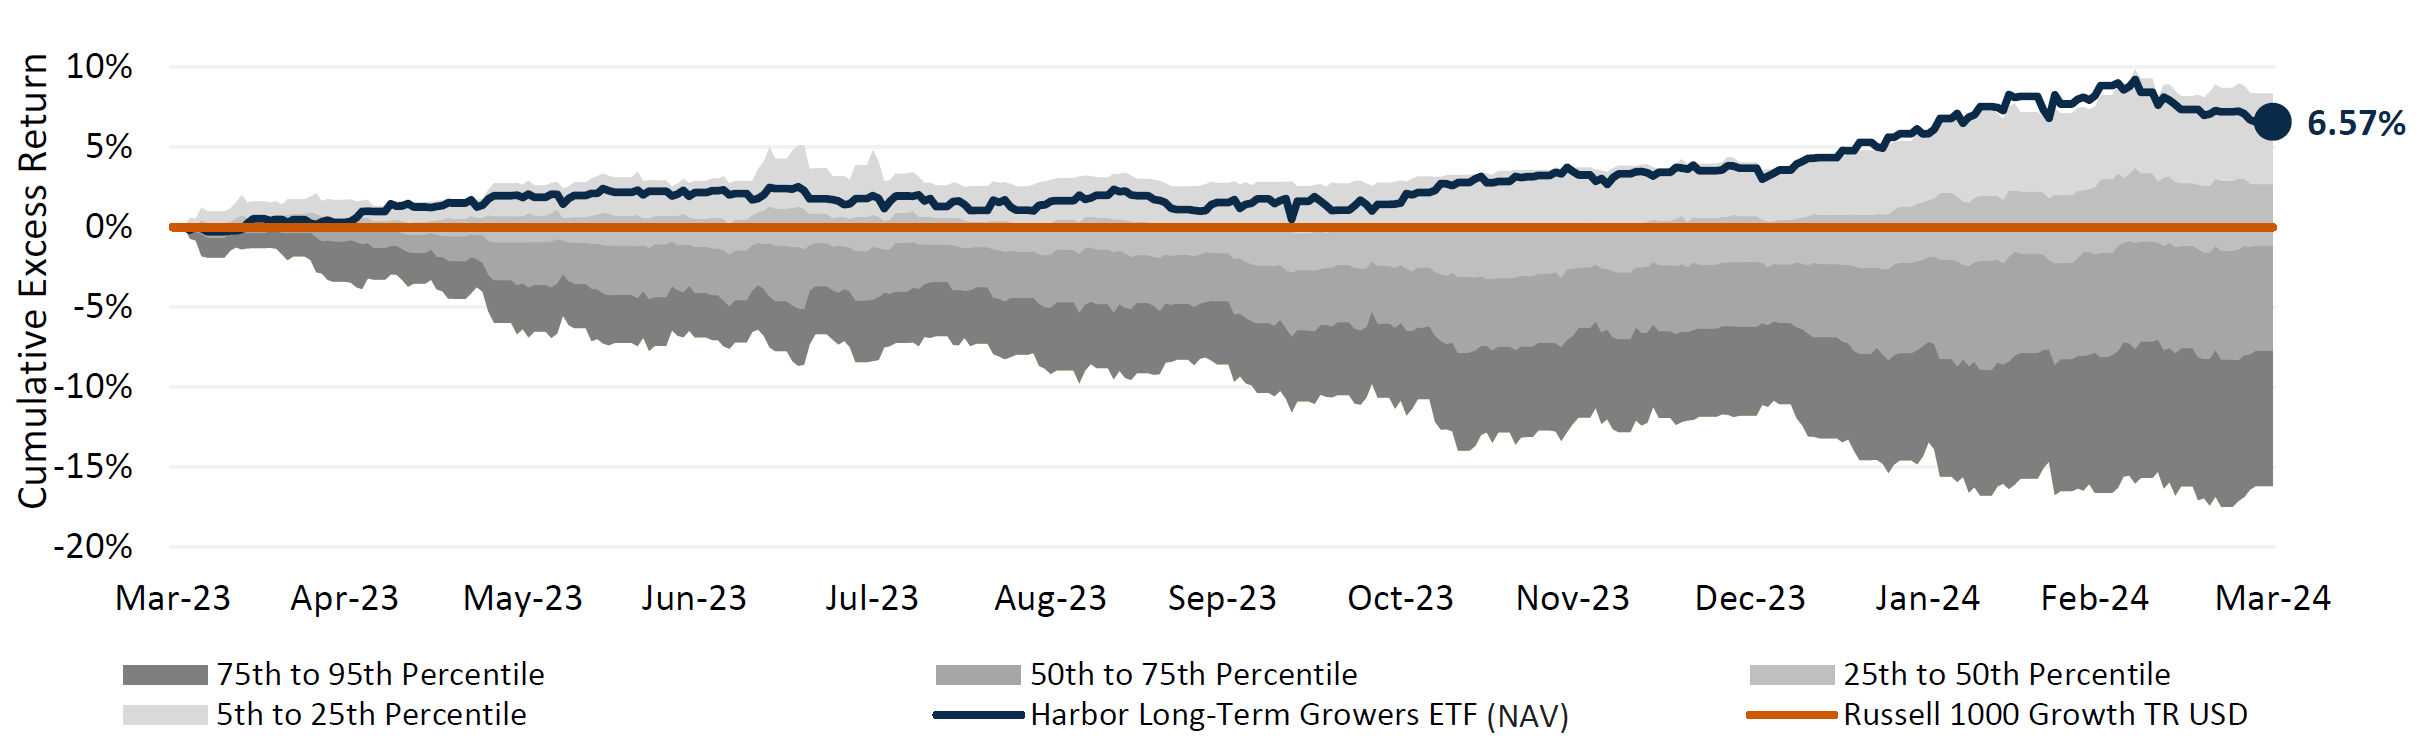
Performance data shown represents past performance and is no guarantee of future results. Past performance is net of management fees and expenses and reflects reinvested dividends and distributions. Past performance reflects the beneficial effect of any expense waivers or reimbursements, without which returns would have been lower. Investment returns and principal value will fluctuate and when redeemed may be worth more or less than their original cost. Returns for periods less than one year are not annualized. Current performance may be higher or lower and is available through the most recent month end at harborcapital.com or by calling 800-422-1050. The highest (or most favorable) percentile rank is 1 and the lowest (or least favorable) percentile rank is 100. The Harbor Long-Term Growers ETF was ranked (based on total returns) against Morningstar's US Large Growth category as percentile ranks, quarterly, over the following time periods: 113 out of 1,191 investments in the category for the 1-year period as of 03/31/2024. Source: Morningstar Direct.
For the most current quarter or month end performance, please click here.
- The Harbor Long-Term Growers ETF has exhibited strong consistency of benchmark-relative outperformance versus category peers across varying market conditions.
- WINN's batting average ranked within the 4th percentile of Morningstar's US Large Growth category over the last 12 months, a period where growth equities generally proved in favor.
- Since its inception, the Harbor Long-Term Growers ETF’s batting average ranked within the 17th percentile of category peers amidst an environment marked by style rotation and shifting sentiment pertaining to U.S. inflation and Fed policy.
Batting Average Rankings as of 3/31/2024 (Monthly)
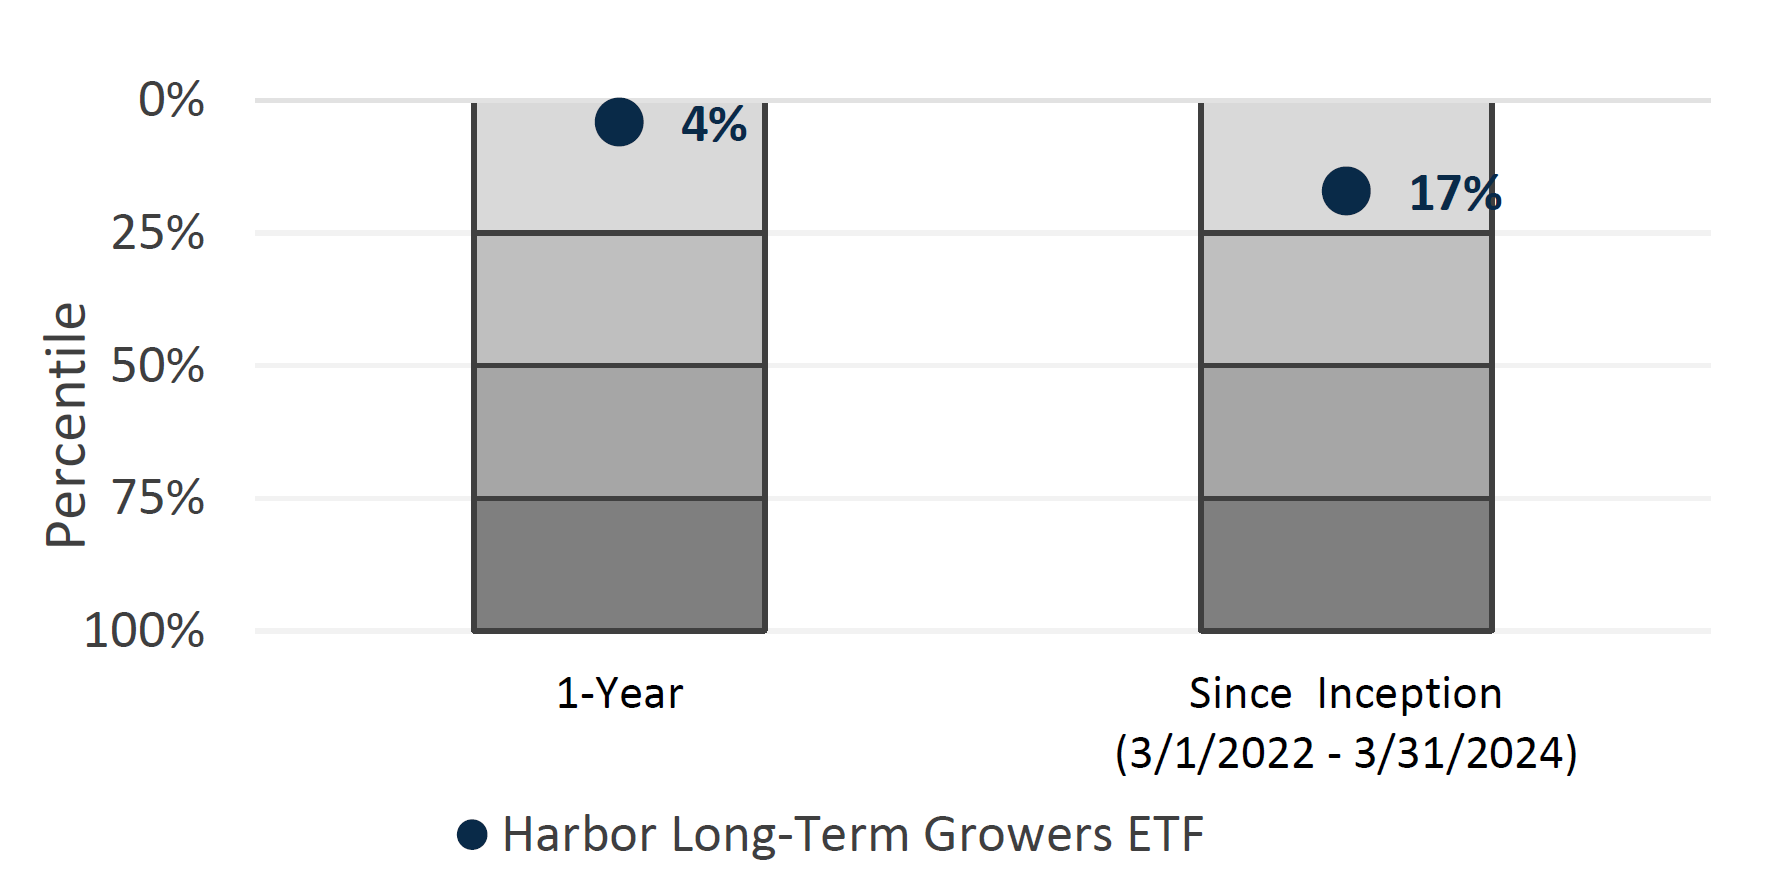
4/1/2023 through 3/31/2024 4th percentile out 1,202 investments in the category as of 3/31/2024. 3/1/2022 through 3/31/2024 17th percentile out of 1,180 investments in the category as of 3/31/2024. Source: Morningstar Direct.
- Founded in 1969 and headquartered in New York City, Jennison Associates has one of the longest growth equity track records in the industry*.
- Harbor's partnership with Jennison Associates spans over five decades. Also, Jennison has managed the Harbor Capital Appreciation Fund since May 1990, employing its disciplined investment philosophy and approach for over 33 years.
- Jennison's flagship Large Cap Growth Equity strategy made up $87 billion of the firm's $208 billion total AUM as of 03/31/2024.
- The Harbor Long-Term Growers ETF (ticker: WINN) applies the time-tested philosophy and approach of Jennison's Large Cap Growth Equity team and invests across an expanded opportunity set sourced across Jennison's other growth strategies.
- Jennison Associates' Custom Solutions Group employs an optimization process within the Harbor Long-Term Growers ETF to incorporate the investment team's fundamental growth insights, considering diversification and liquidity risk. This results in portfolio exposures and characteristics aligned with WINN's investment objectives.
| Harbor Long-Term Growers ETF Portfolio Management Team |
Kathleen McCarragher Firm years of experience: 26 |
Blair Boyer Firm years of experience: 32 |
Natasha Kuhlkin Firm years of experience: 20 |
Jason McManus Firm years of experience: 27 |


| Depth & Breadth of Investment Platform1 |
Large Cap Growth Average experience > 20 years | Other Growth Investment Teams Average experience > 20 years | Custom Solutions Group Average experience > 15 years |
*Inception of Jennison's Large Cap Growth Equity Composite: 7/31/1969. Source: Jennison Associates.
1. Average industry experience listed in this section.
As of 3/31/2043.
1. Average industry experience listed in this section.
- Jennison's team believes that companies that possess durable competitive advantages driving superior levels of earnings and cash flow growth are best positioned to deliver excess returns over the long-term.
- Jennison employs a bottom-up, research intensive process within an effective universe of 500+ companies. Research analysts perform detailed analysis on 150+ companies that meet the team's investment criteria; company management meetings are a critical component of the process.
- Analysts utilize a variety of different valuation methodologies appropriate to different industries and seek to understand companies' embedded growth rates in current valuations.
- The team maintains a longer-term view of 3 to 5 years and ultimately seeks companies with catalysts driving long-term growth, skilled management teams, balance sheet strength, and appropriate valuations.
- Risk management is embedded throughout the process, while the optimization of Jennison's Custom Solutions Group seeks a a well-diversified portfolio with exposures across growth sectors.
- Jennison's disciplined emphasis on companies with multi-year structural growth opportunities has produced a compelling estimated 3-5YR EPS growth premium versus the Russell 1000 Growth Index and broad market equities (S&P 500 Index) since WINN's inception.
| Ticker Symbol | WINN |
| Cusip | 41151J406 |
| Listed Exchange | NYSE |
| Gross Expense Ratio | 0.57% |
| Lead Market Maker | GTS Mischler |
| Inception Date | 2/2/2022 |
| Manager Name | Jennison Associates |
| Benchmark | Russell® 1000 Growth Index |
| Morningstar Category | Large Growth |
Est. 3-5YR EPS Growth
2/28/2022 -3/31/2024 (Monthly)
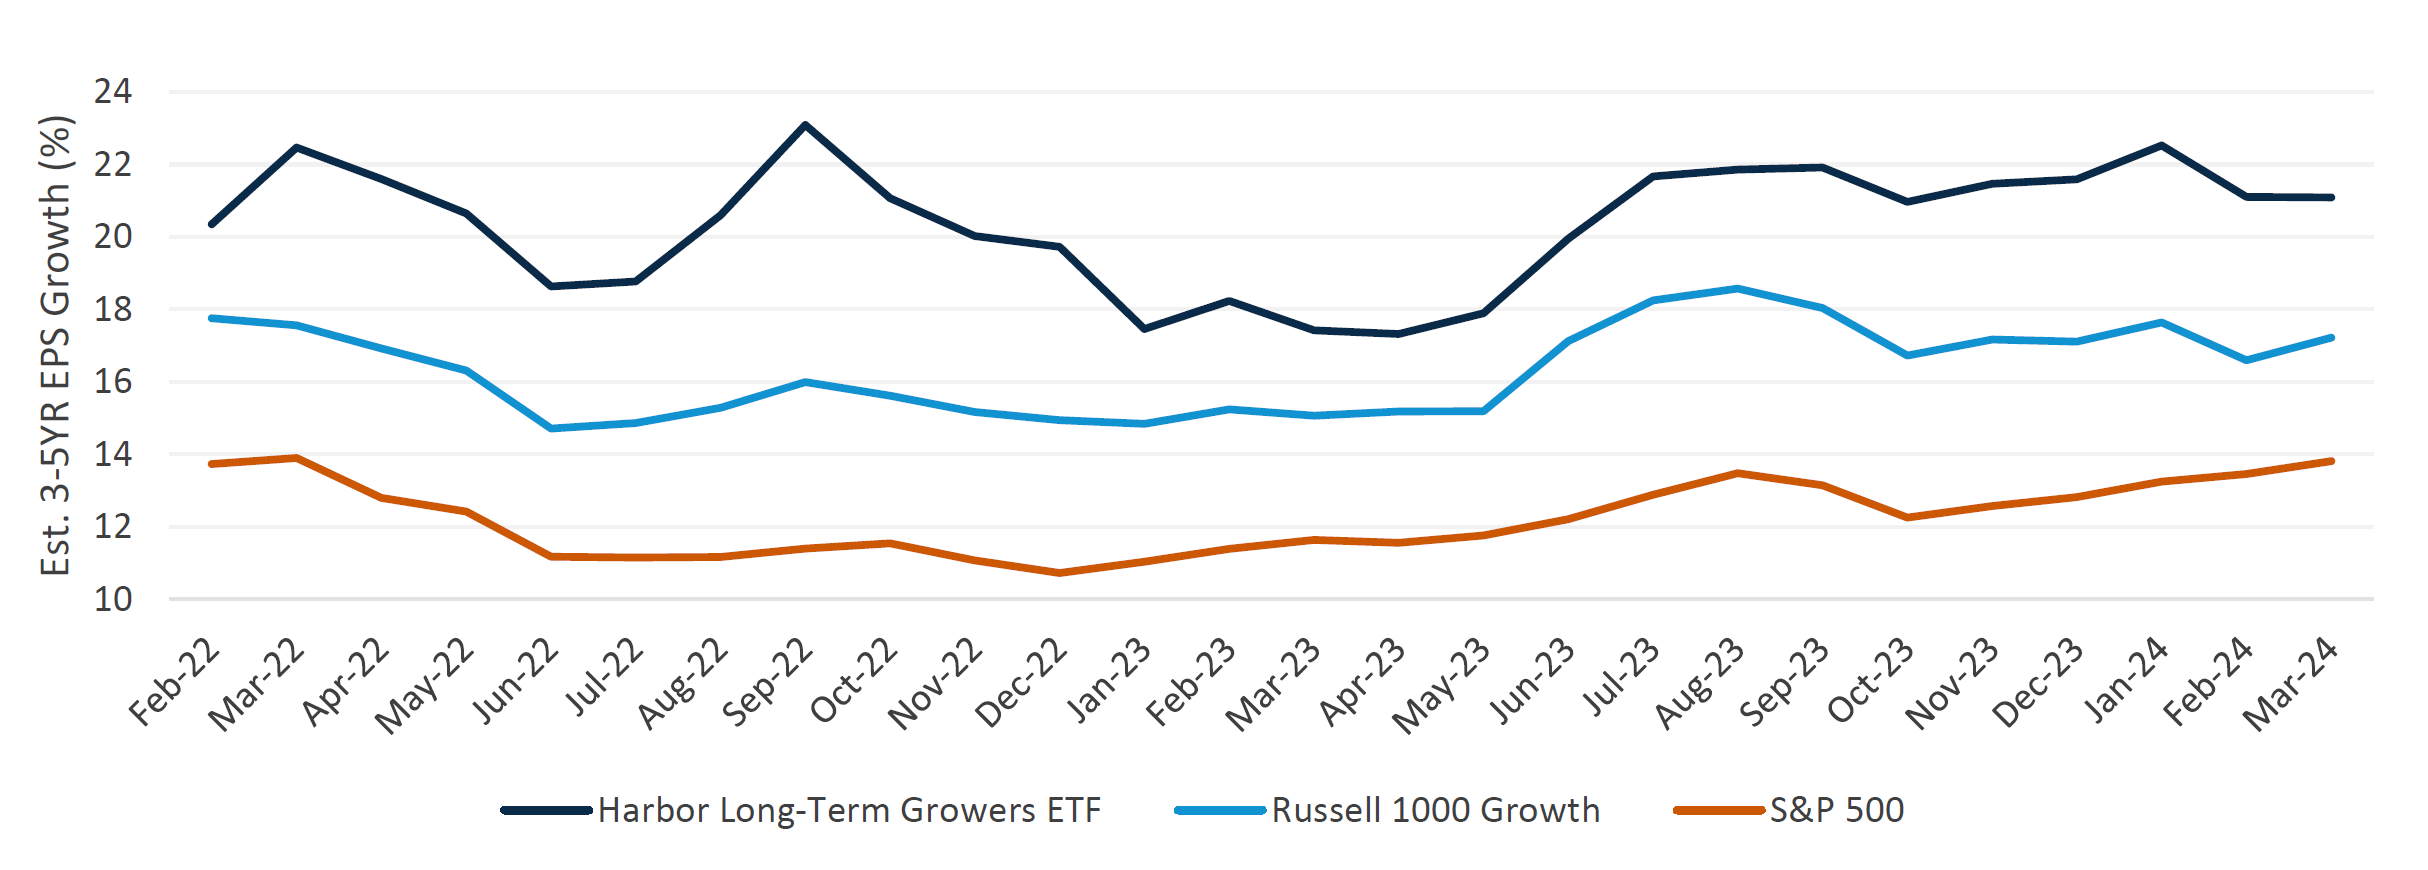
Performance data shown represents past performance and is no guarantee of future results. Source: FactSet Research Systems.
Important Information
For Institutional Use Only - Not For Distribution to the Public.
Investing involves risk, principal loss is possible. Unlike mutual funds, ETFs may trade at a premium or discount to their net asset value. Shares are bought and sold at market price not net asset value (NAV). Market price returns are based upon the closing composite market price and do not represent the returns you would receive if you traded shares at other times.
There is no guarantee that the investment objective of the Fund will be achieved. Stock markets are volatile and equity values can decline significantly in response to adverse issuer, political, regulatory, market and economic conditions. Investing in international and emerging markets poses special risks, including potentially greater price volatility due to social, political and economic factors, as well as currency exchange rate fluctuations. These risks are more severe for securities of issuers in emerging market regions. A non-diversified Fund may invest a greater percentage of its assets in securities of a single issuer, and/or invest in a relatively small number of issuers, it is more susceptible to risks associated with a single economic, political or regulatory occurrence than a more diversified portfolio.
The Russell 1000® Growth Index is an unmanaged index generally representative of the U.S market for larger capitalization growth stocks. The Russell 1000® Growth Index and Russell® are trademarks of Frank Russell Company. This unmanaged index does not reflect fees and expenses and is not available for direct investment.
© 2024 Morningstar, Inc. All rights reserved. The information contained herein:(1) is proprietary to Morningstar and/or its content providers; (2) may not be copied or distributed; and (3) is not warranted to be accurate, complete, or timely. Neither Morningstar nor its content providers are responsible for any damages or losses arising from any use of this information. Past performance is no guarantee of future results.
The Morningstar Rankings are based on total returns, with distributions reinvested and operating expenses deducted. Morningstar does not take into account sales charges. Harbor Long-Term Growers ETF was ranked against Morningstar's US Large Growth category as percentile ranks, quarterly, over the following time periods: 74 out of 1,200 investments in the category for the 1-year period as of 12/31/2023.
Alpha is a measure of risk (beta)-adjusted return.
The Batting Average of the manager is the ratio between the number of periods where the manager outperforms a benchmark and the total number of periods.
Earnings per share (EPS) is the portion of a company's profit allocated to each outstanding share.
The Est 3-5 Yr EPS Growth (%) is the estimated growth of earnings per share over the next 3-5 years, using pre-calculated mean long-term EPS growth rate estimates, which are calculated using each individual broker's methodology, from FactSet, First Call, I/B/E/S Consensus, and Reuters. Forward looking estimates may not come to pass.
The views expressed herein may not be reflective of current opinions, are subject to change without prior notice, and should not be considered investment advice or a recommendation to purchase a particular security.
Jennison Associates is a third-party subadvisor to the Harbor Long-Term Growers ETF.
Foreside Fund Services, LLC is the Distributor of the Harbor ETFs.
3517780
