 Contact
Harbor 2024 Global Market Outlook
Finding Bright Spots
December 21, 2023


As we look back on 2023 and toward the possibilities of 2024, we are reminded that much remains unanswered in the market from the path of interest rates and ongoing geopolitical tensions to the potential for a recession and innovation in artificial intelligence. Despite these uncertainties, we recently discussed some prospective bright spots that may make for attractive opportunities as part of a lively panel with three of Harbor’s active, boutique investment managers.
Active Management
We appreciate that active investment managers are able to navigate through a range of macro conditions with less constraints than index funds that are required to more closely match their respective benchmarks. Unlike passive alternatives, skilled active managers seek to equip themselves with the ability to detect and avoid potential performance laggards, as well as to identify those businesses best positioned to withstand or benefit from prevailing market conditions, and adjust exposures accordingly.
Relative Valuations at Extremes – Small Caps are Cheap vs. History Relative to Large Cap Across All Metrics
Small vs. Large Valuations vs. History
Russell 2000 vs. Russell 1000, 1985 to 10-31-23
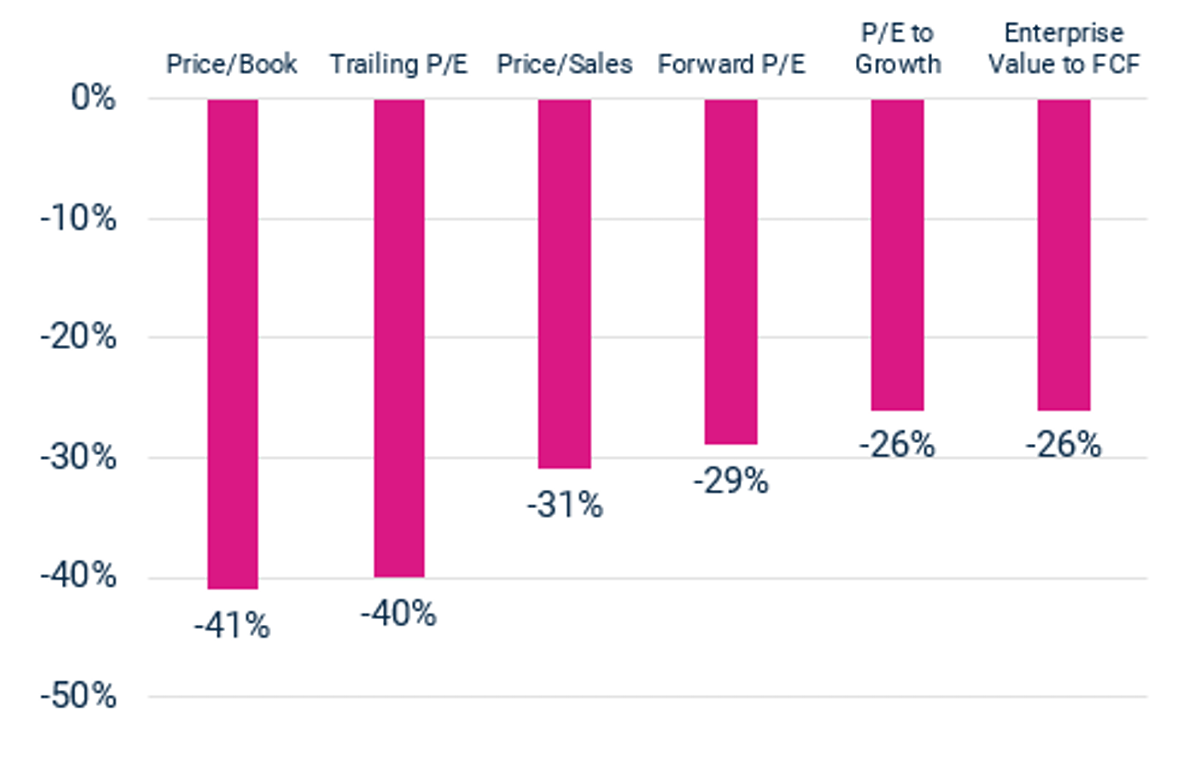
Source: BofA US Equity & Quant Strategy Research, as of 11/16/2023
Content is based on Westfield’s views and is subject to change.
Performance data shown represents past performance and is no guarantee of future results.
Notably, Will Muggia, President, Chief Executive Officer & Chief Investment Officer at Westfield Capital Management, astutely called attention to the attractive relative valuations of small caps versus large caps that are sitting at multiple standard deviations from the mean at the end of 2023. In Westfield’s assessment, changes in small-to-large cap cycles historically followed extremes in market index concentration, valuations and/or performance, making active management in this asset class attractive at present. As part of our recent panel, we learned that more than 50% of our 106 respondents agreed with this sentiment, holding a “positive” or “ready to add following a recession” stance on small caps.
Health Care Investments
Another corner of the market identified by our panel with potentially attractive investment opportunities in 2024 is the health care sector.
A Global Epidemic: Obesity
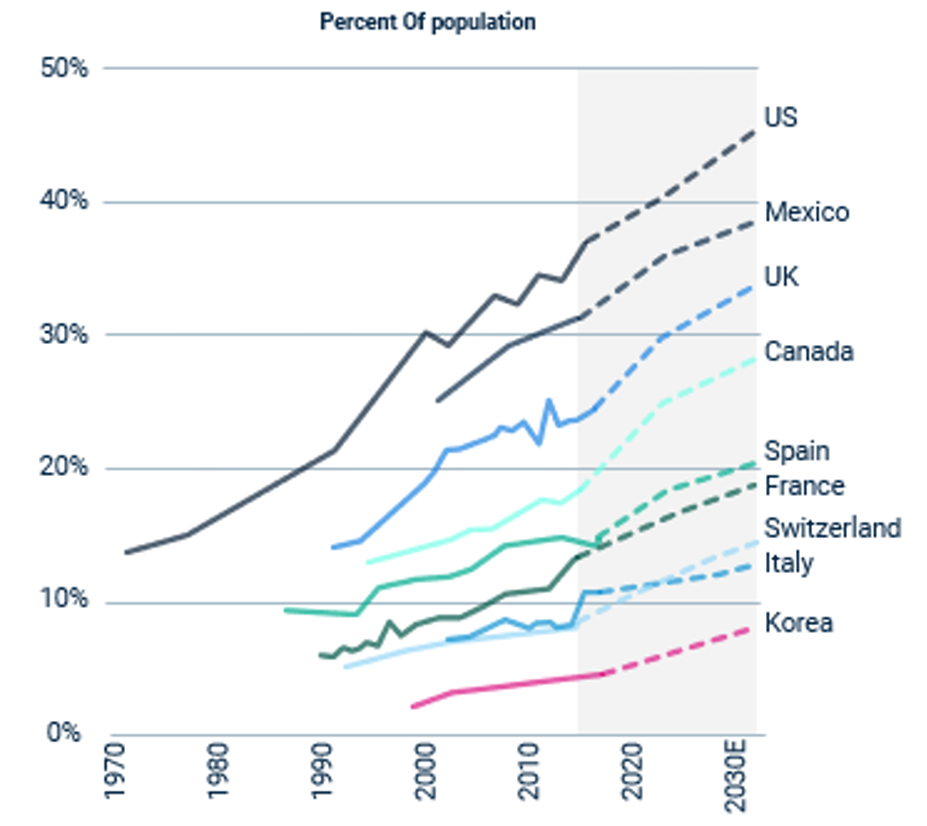
Source: OECD analysis of national health survey data, as of November 2023
Performance data shown represents past performance and is no guarantee of future results.
As recognized by panelist Morten Springborg, Global Thematic Specialist at C WorldWide, he believes the rise in global obesity and the subsequent popularity of new anti-obesity drugs make early movers in this category well positioned to provide an in-demand solution for a growing problem.
In the same vein, Will Muggia observed that following a period of over capitalization and investor euphoria in Biotech that peaked in February 2021, we have seen a precipitous decline in valuations, all while many high-quality companies have made significant progress in clinical trials and have dramatically improved intrinsic value.
Recent Underperformance Has Created Opportunity
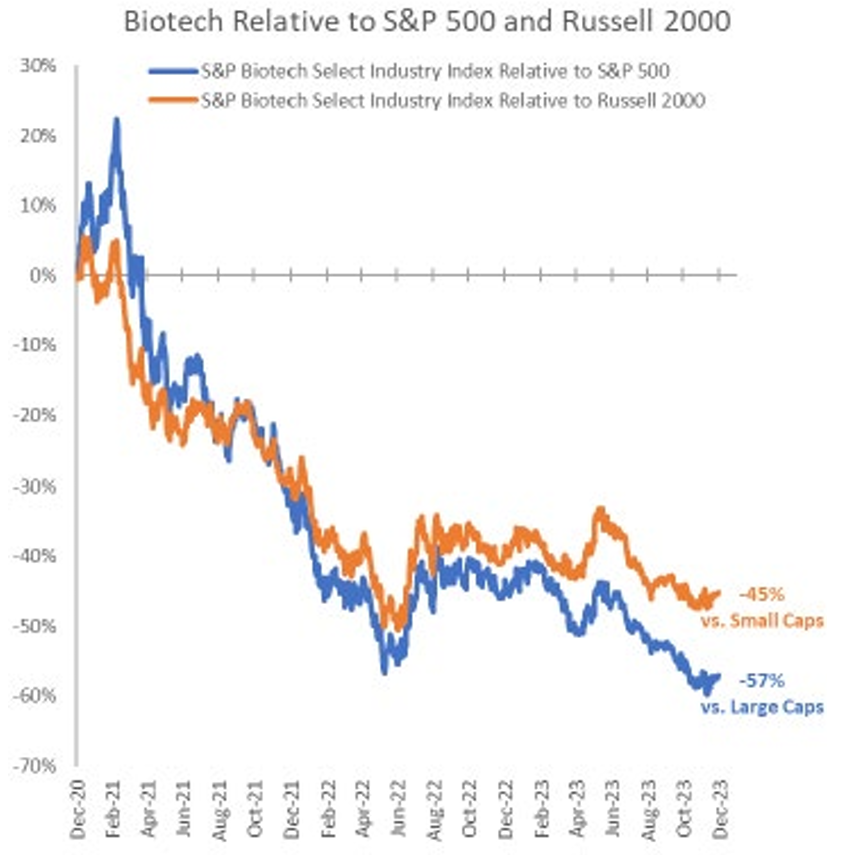
Source: Westfield, FactSet, as of 11/26/2023
Content is based on Westfield’s views and is subject to change.
Performance data shown represents past performance and is no guarantee of future results
He noted that in facing mature product cycles, large cash balances, and extremely attractive valuations in small cap Biotech, large cap BioPharma companies are eyeing mergers and acquisitions to fill upcoming revenue gaps. He believes an unprecedented wave of merger activity is on the horizon.
Overall, the pace of innovation in drug development is accelerating and is driving dramatic changes in treatment options, affording opportunity for skilled, active managers to recognize those companies best positioned to recognize upside.
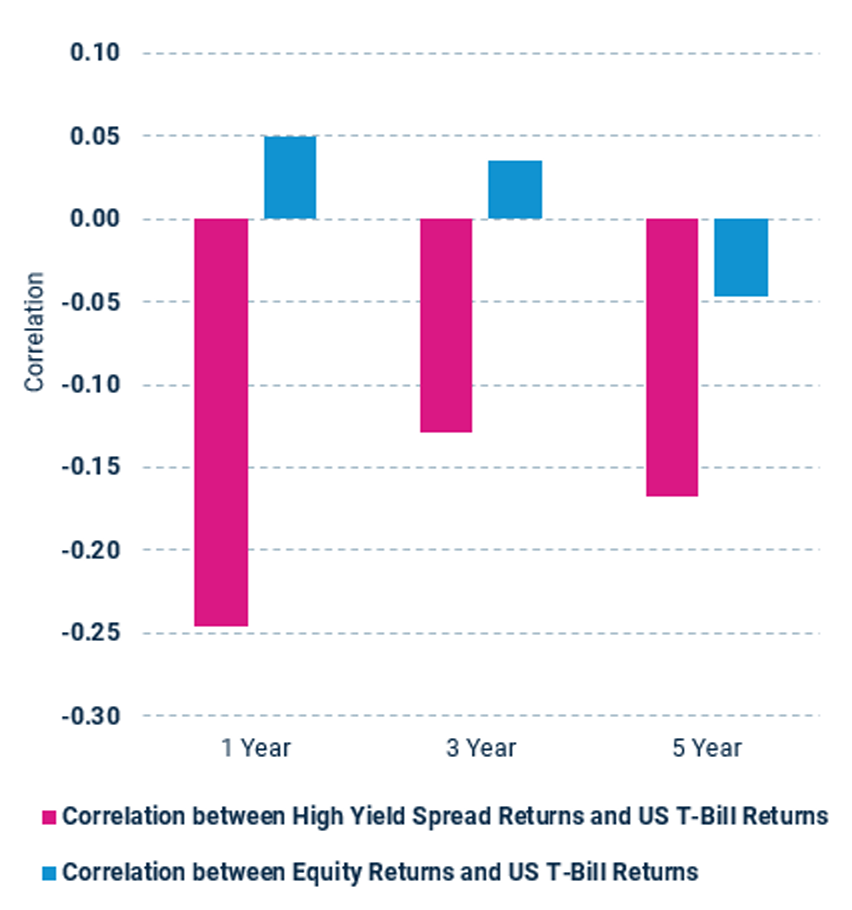
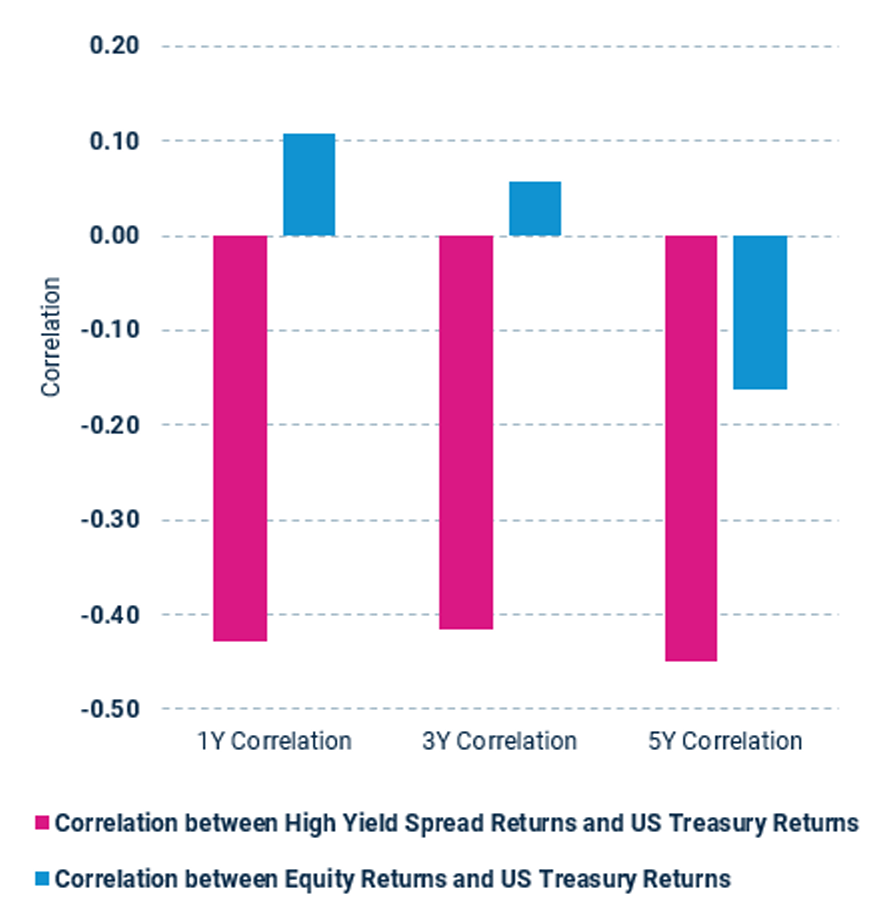
Credit Risk as an Alternative to Equity Risk
Finally, Garth Flannery, Head of Asset Allocation at BlueCove, spoke to the idea that credit risk could make for a potentially attractive substitute for equity risk given today’s conditions.
More Negatively correlated with T-Bills1
More Negatively correlated with Treasuries2
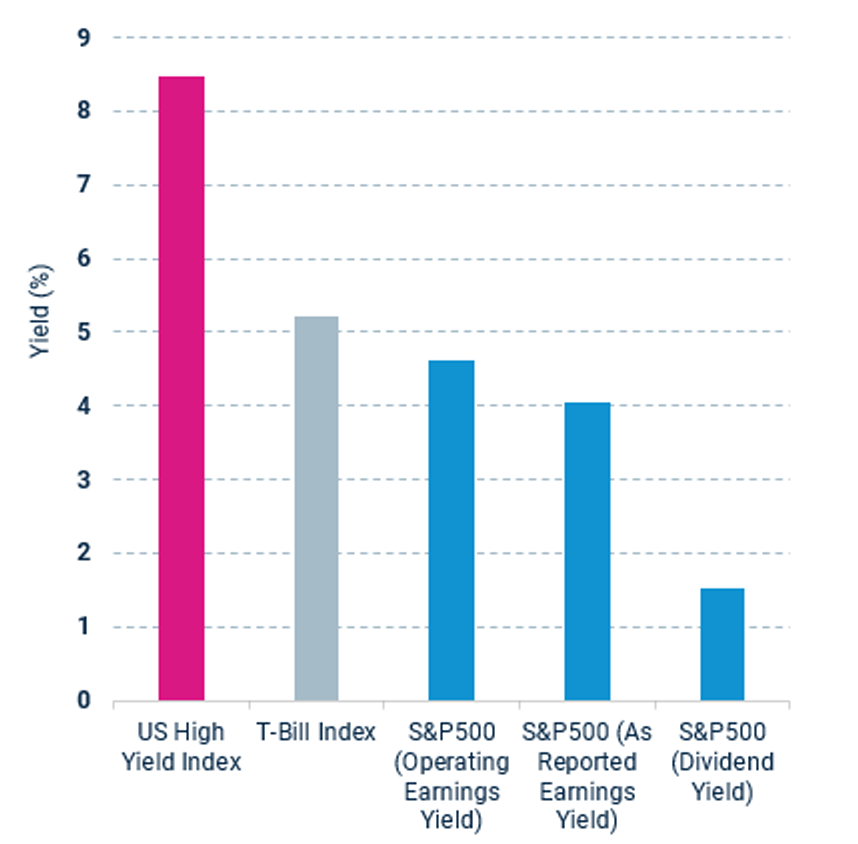
Significantly higher yield3
-
Source: ICE BofA US Treasury Bill Index (G0BA) Total Returns; ICE BofA US High Yield Index (H0A0) Excess Returns; S&P500 (Bloomberg SPTR Index) Total Returns; 1,3 and 5 year windows trailing from 23 November 2023.
-
Source: ICE BofA US Treasury Index (G0Q0) Total Returns; ICE BofA US High Yield Index (H0A0) Excess Returns; S&P500 (Bloomberg SPTR Index) Total Returns; 1,3 and 5 year windows trailing from 23 November 2023.
-
Source: ICE BofA US High Yield Index (H0A0) Effective Yield; ICE BofA US Treasury Bill Index (G0BA) Effective Yield; S&P500 yield calculated from S&P500 price (Bloomberg SPX Index) and trailing 12 month Operating Earnings, As Reported Earnings, and Dividends from S&P
Performance data shown represents past performance and is no guarantee of future results.
In particular, now may be a good time to make the transition if looking to achieve diversification in your portfolio, given that high yield spread returns have been more negatively correlated to US T-Bill returns or US Treasury Returns than either equity returns while offering nearly double yields.
Per our polling topic on the question, more than 50% of 92 respondents believe “the combination of headline yield could provide equity like returns from here.”
Important Information
The views expressed herein may not be reflective of current opinions, are subject to change without prior notice. This material is for informational and illustrative purposes only. This material does not constitute investment advice and should not be viewed as a current or past recommendation or a solicitation of an offer to buy or sell any securities or to adopt any investment strategy.
There is greater risk when investing in below-investment grade fixed income securities and unrated securities of similar credit quality (commonly referred to as “high-yield securities” or “junk bonds”). These securities are considered speculative because they have a higher risk of issuer default, are subject to greater price volatility and may be illiquid. The health care industry may be affected by any number of factors, including, but not limited to, lapsing patent protection, industry innovation, extensive government regulation, restrictions on government reimbursement for medical expenses, research and development costs, limited product lines, product liability litigation, an increased emphasis on outpatient services, and competitive forces.
Investing entails risks and there can be no assurance that any investment will achieve profits or avoid incurring losses. Stock markets are volatile and equity values can decline significantly in response to adverse issuer, political, regulatory, market and economic conditions. Stocks of mid cap companies pose special risks, including possible illiquidity and greater price volatility than stocks of larger, more established companies.
The price-to-book (P/B) ratio measures the market's valuation of a company relative to its book value.
The trailing price-to-earnings ratio looks at a company's share price in the market relative to its past year's earnings per share.
The price-to-sales (P/S) ratio shows how much investors are willing to pay per dollar of sales for a stock.
The price/earnings (P/E) ratio relates a company's share price to its earnings per share.
Forward P/E is a version of the ratio of price-to-earnings that uses forecasted earnings for the P/E calculation.
The PEG (price/earnings to growth) ratio enhances the P/E ratio by adding expected earnings growth into the calculation.
The enterprise value/free cash flow ratio compares its enterprise value (or total value as often used as a more comprehensive alternative to market capitalization) to its free cash flow.
Standard deviation is a statistic that measures the dispersion of a dataset relative to its mean and is calculated as the square root of the variance.
Correlationis a statistic that measures the degree to which two variables move in relation to each other.
Certain forecasts, estimates and returns are based on hypothetical assumptions. It is for informational and illustrative purposes only. This material does not constitute investment advice and should not be viewed as a current or past recommendation or a solicitation of an offer to buy or sell any securities or to adopt any investment strategy. The forecasts, estimates and return presented do not represent the results that any particular investor may actually attain. Actual performance results will differ, and may differ substantially, from the hypothetical information provided.
Indices listed are unmanaged and do not reflect fees and expenses and are not available for direct investment.
Polling: The abovementioned were Harbor created poll conducted during the 2024 Global Market Outlook webinar on December 6, 2023. Respondents consisted of institutional investors/advisors who were invited to participate in the online webinar. The were a total of 174 participants. For the small cap polling question, 106 participants responded. For the high yield polling question, 92 participants responded.
The Russell 1000 Index® represents the top 1000 companies by market capitalization in the United States. The Russell 2000 Index® is a market index comprised of 2,000 small-cap companies. The Russell 2000® Index and the Russell 1000® Index are trademarks of Frank Russell Company. The ICE BofA U.S. Treasury Index tracks the performance of U.S. dollar-denominated sovereign debt publicly issued by the U.S. government in its domestic market. The ICE BofA U.S. High Yield Index is an unmanaged index that tracks the performance of U.S. dollar denominated, below investment-grade rated corporate debt publicly issued in the U.S. domestic market. The S&P 500 Index is a marketcapitalization-weighted index of 500 leading publicly traded companies in the U.S. The S&P Biotechnology Select Industry Index comprises stocks in the S&P Total Market Index that are classified in the GICS Biotechnology sub-industry.
Diversification does not assure a profit or protect against loss in a declining market.
Harbor Capital Advisors, Inc.
3295394


