 Contact
Core Fixed Income
Opportunities & Considerations for 2024 & Beyond
February 06, 2024vs. Actual US 10YR Treasury Yield Estimates
2014-2023
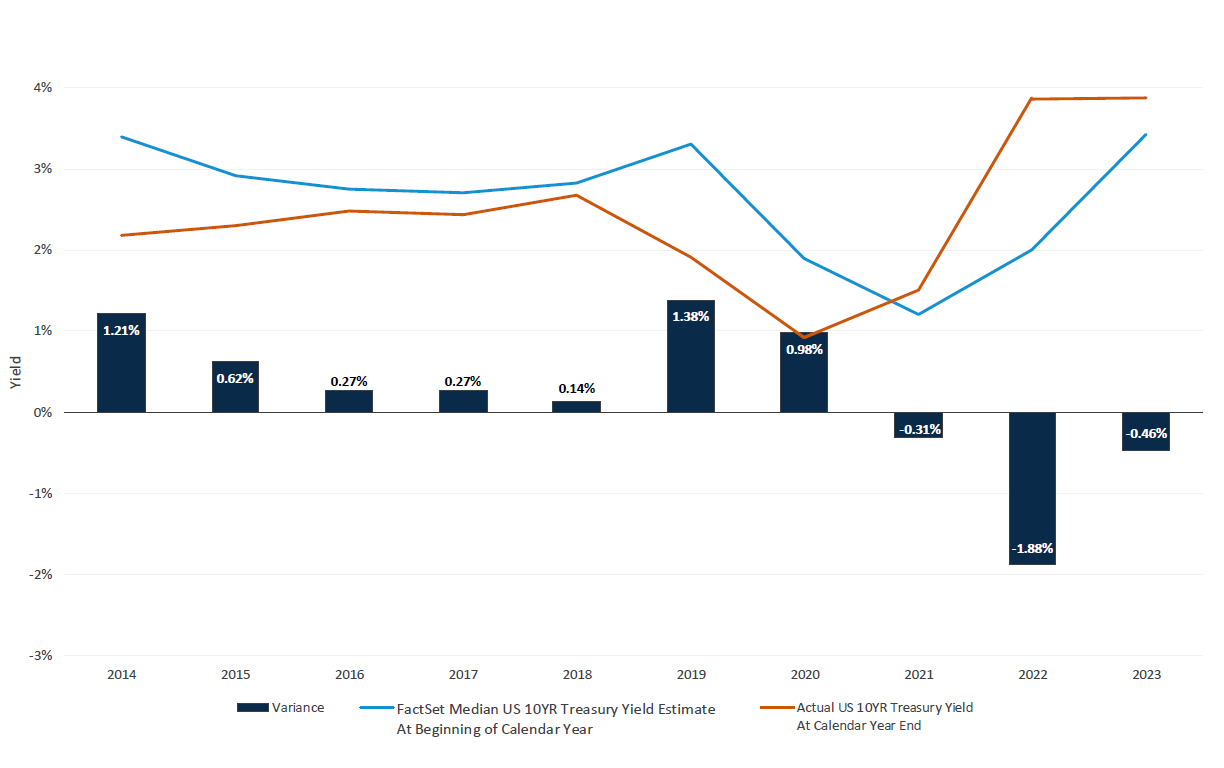
- Since FactSet began tracking economist calendar year U.S. 10-year Treasury yield forecasts in 2014, median predictions have only come within 20 basis points of actual year end US 10YR Treasury yields once (in 2018)
- On an absolute value basis, median forecasts have varied from actual yields on average by 75 basis points over the last 10 years
- The trend lines show that not only have forecasts been off in terms of yield timing, they’ve also at times been off in predicting the direction of interest rates (such as in 2021)
Source: FactSet Research Systems. Performance data shown represents past performance and is no guarantee of future results.
Rolling 3YR Standard Deviation
Jan 2014 - Dec 2023 (Monthly)
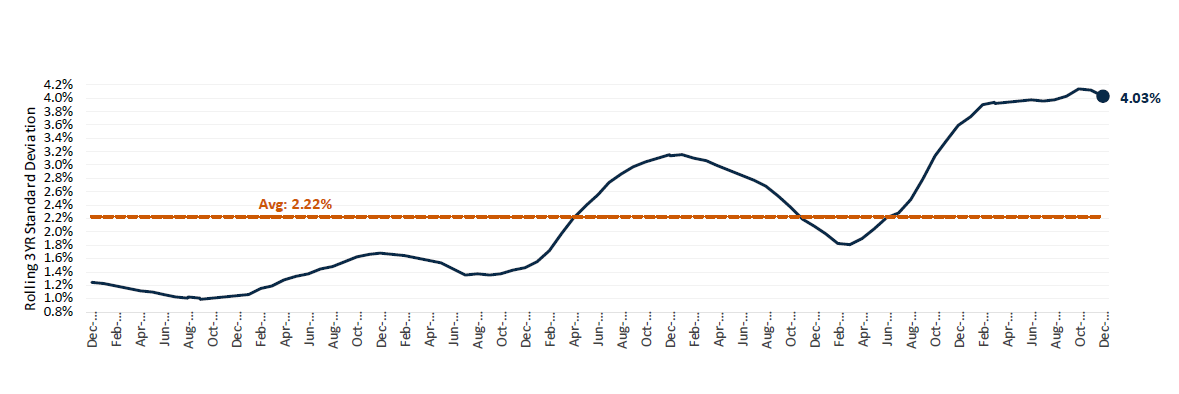
- Interest rate volatility has become elevated since early 2020
- The rolling 3-year standard deviation of the U.S. 10-year Treasury yield has increased to 4.03% as of 12/31/2023. This is 1.8x greater than its 10YR average of 2.22%
vs. Forward 3-Month US 10YR Treasury Yield
Jan 2021 - Dec 2023 (Quarterly)
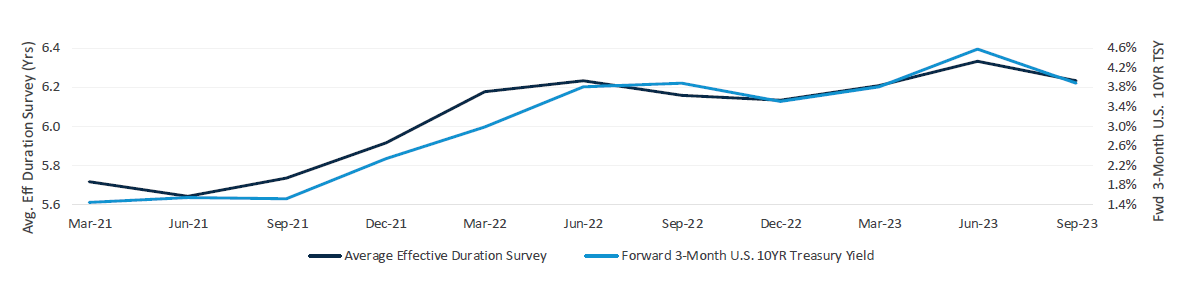
- Active Intermediate Core Plus Funds have recently experienced challenges in timing duration bets
- Over the last 3 years, on average, category funds have generally decreased or increased duration only to see
rates move in the same direction three months later
- Amidst a backdrop of heightened interest rate volatility, duration neutral, security selection-driven strategies
appear well positioned for the road ahead
Source: FactSet Research Systems. Performance data shown represents past performance and is no
guarantee of future results.
Active funds include open-ended mutual funds which are not index
funds and enhanced index funds, as defined by Morningstar.
Jan 2014 - Dec 2023 (Monthly)
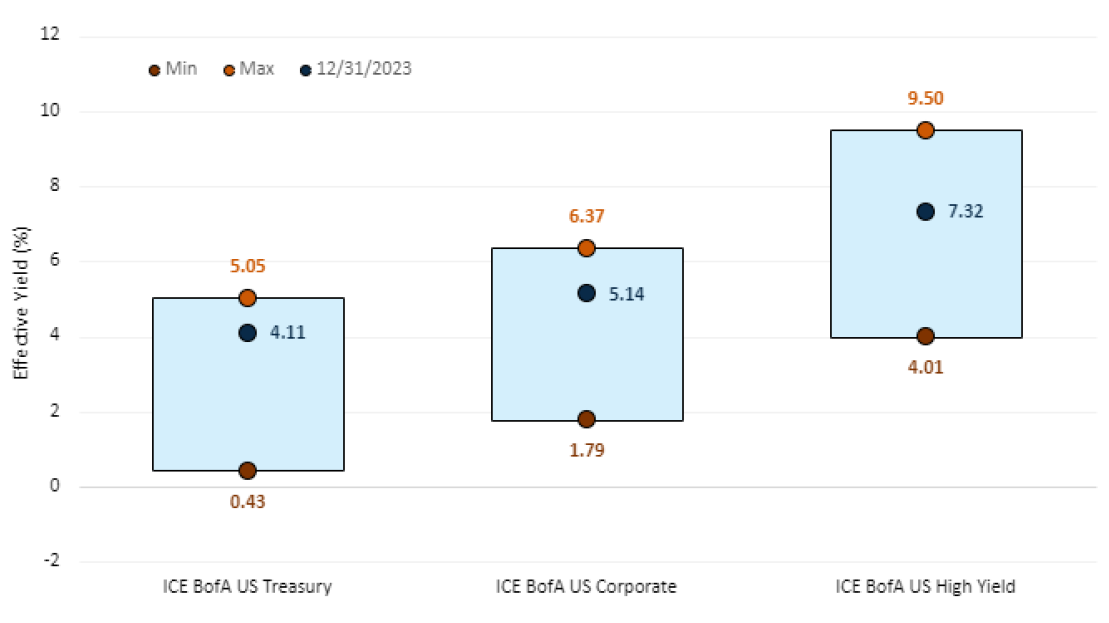
- After bottoming amidst the pandemic in 2020, effective yields have generally risen across the fixed income landscape
- Compared to the last 10 years, ending Dec 2023, current effective yields for areas such as U.S. Treasuries,
Investment Grade U.S. Corporates and U.S. High Yield bonds are higher than average on an absolute basis
Source: Ice Data Indices, LLC. Performance data shown represents past performance and is no guarantee of future results.
Jan 1980 - Dec 2023 (monthly)
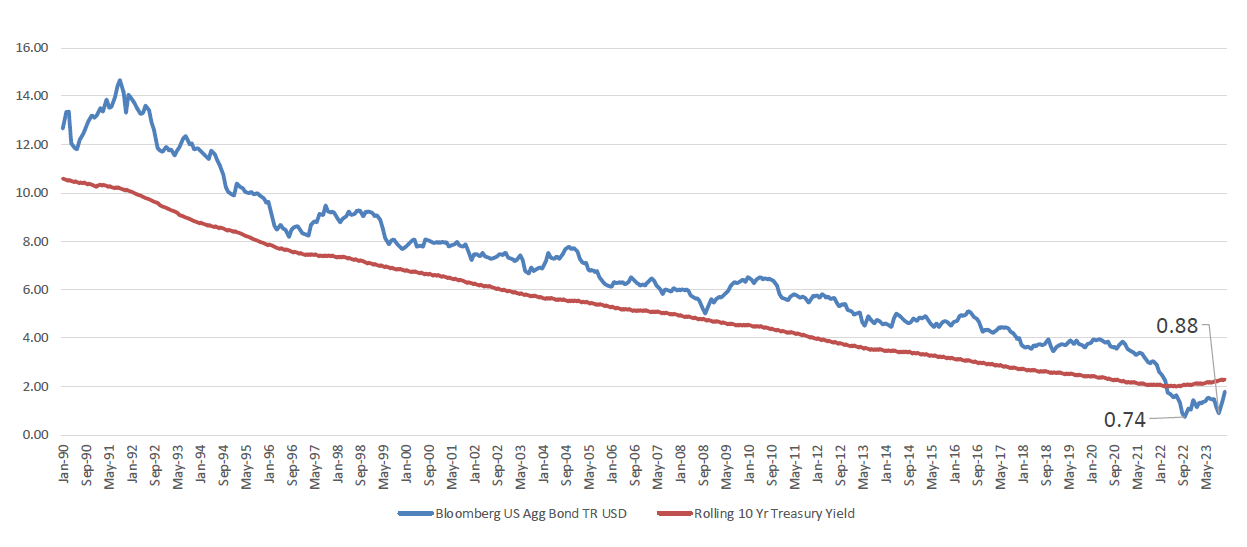
- Over the long-term, returns for Core /Core Plus fixed income have been highly correlated with prevailing yields
- Specifically, the chart on the right shows the rolling 10-year return of the Bloomberg U.S. Agg Bond Index vs
the rolling U.S. 10-year Treasury yield back to the Agg’s inception in 1980
- A few key points that stand out:
- The correlation between these two data sets has been 0.98 – meaning that lower rates have coincided with
lower returns, and vice versa
- Falling interest rates for many years leading up to the pandemic nearly led to a “lost decade” for the
Bloomberg U.S. Agg Index, with 10-year returns ending 10/31/2022 and 10/31/2023 lower than 1%
- Aside from Apr 2022 – Dec 2023, long-term Bloomberg U.S. Agg Returns have consistently outstripped 10-year
Treasury yields, highlighting the advantages of compounding spread income over time (yield over treasuries of
U.S. corporate and Securitized sectors within the Bloomberg U.S. Agg Index)
- The correlation between these two data sets has been 0.98 – meaning that lower rates have coincided with
lower returns, and vice versa
Source: FactSet, Morningstar Direct. Performance data shown represents past performance and is no guarantee of future results.
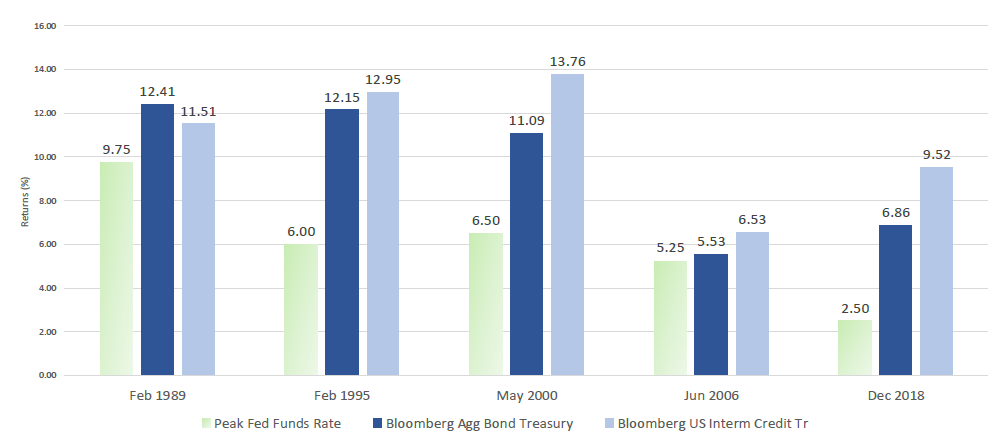
- Historically, U.S. Treasuries and Investment Grade Corporate Bonds have delivered solid absolute returns for the
1-year period following peak Fed Funds Rates
- With market participants forecasting multiple Fed Funds cuts in 2024, we may have reached a peak Fed Funds Rate in this cycle in July 2023
Source: Morningstar Direct. December 2023. Performance data shown represents past performance and is no guarantee of future results.
Important Information
The views expressed herein may not be reflective of current opinions, are subject to change without prior notice, and should not be considered investment advice or a recommendation to purchase or sell a particular security.
Past performance is no guarantee of future results.
The Bloomberg US Aggregate Bond Index is an unmanaged index of investment-grade fixed-rate debt issues with maturities of at least one year. This unmanaged index does not reflect fees and expenses and is not available for direct investment.
© Morningstar 2023. All rights reserved. Use of this content requires expert knowledge. It is to be used by specialist institutions only. The information contained herein: (1) is proprietary to Morningstar and/or its content providers; (2) may not be copied, adapted or distributed; and (3) is not warranted to be accurate, complete or timely. Neither Morningstar nor its content providers are responsible for any damages or losses arising from any use of this information, except where such damages or losses cannot be limited or excluded by law in your jurisdiction. Past financial performance is no guarantee of future results.
A basis point is one hundredth of 1 percentage point.
Duration is a commonly used measure of the sensitivity of the price of a debt security, or the aggregate market value of a portfolio of debt securities, to change in interest rates. Securities with a longer duration are more sensitive to changes in interest rates and generally have more volatile prices than securities of comparable quality with a shorter duration.
Standard deviation measures the dispersion of a dataset relative to its mean.
Investing entails risks and there can be no assurance that any investment will achieve profits or avoid incurring losses.
Diversification does not assure a profit or protect against loss in a declining market.
Harbor Capital Advisors, Inc.
3379298


