 Contact
The Case for Dividend Growth
Harbor Dividend Growth Leaders ETF (GDIV)
August 25, 2023Dividend growth investing focuses on companies with the potential to increase dividend payments. (While often grouped together, this approach differs from dividend yield investing which focuses on companies with high, rather than growing, dividend yields). The combination of dividend focus, and growth orientation may allow investors to participate in up markets while mitigating risk during down markets, and help investors maintain purchasing power amidst high inflationary environments.
Potential Benefits of Dividend Growth Investing
 |  |  |
| Income Generation | High-Quality Equity Exposure | Enhanced Risk-Adjusted Performance |
| Dividend growth strategies focus on companies with sustainable and growing dividends. For investors, this means outsized and growing income potential. | Companies that have the ability to continually increase their dividend distributions are typically supported by strong earnings growth. They also tend to be well capitalized with strong revenue streams and free cash flows.1 | Dividends have historically played an important role in total return. In down and volatile markets, distributions can help buoy total returns. This may help mitigate downside risk with the added benefit of upside participation. |
Dividend Contribution to Total Return | |||||
Price Pct. Change | Dividend Contribution | Total Return | Dividends Pct. of TR | Avg. Payout Ratio | |
1930s | -41.9% | 56.0% | 14.1% | 100.0 | 90.1 |
1940s | 34.5% | 100.1% | 134.6% | 74.4 | 59.4 |
1950s | 257.3% | 180.3% | 437.7% | 41.2 | 54.6 |
1960s | 53.7% | 54.2% | 107.9% | 50.2 | 56.0 |
1970s | 17.2% | 59.1% | 76.4% | 77.4 | 45.5 |
1980s | 227.4% | 143.1% | 370.5% | 38.6 | 48.6 |
1990s | 315.7% | 115.7% | 431.5% | 26.8 | 47.6 |
2000s | -24.1% | 15.0% | -9.1% | 100.0 | 35.3 |
2010s | 189.7% | 66.9% | 256.7% | 26.1 | 35.2 |
2020s | 18.8% | 5.9% | 24.8% | 24.0 | 37.0 |
Average | 114.4% | 87.8% | 202.2% | 59.4 | 52.5 |
Source: Strategas Research Partners as of 12/31/22. S&P index inception date is 1928. | |||||
1 Free cash flow is the money that the company has available to repay its creditors or pay dividends and interest to investors
Dividend Growers vs. Dividend Yielders
It’s important to make the distinction between these two strategy types. While dividend growth strategies are typically characterized by higher- quality companies that are expected to increase their dividends over time, dividend yield strategies can be very different from a portfolio composition perspective. Dividend yield strategies often target and weight their portfolios based solely on dividend yield. Due to its calculation (annual dividends per share / current price per share), portfolio holding companies could simply be high yielding because of their higher dividends, but this may also be because of falling stock prices. In the latter case, these stocks could be considered value traps. These strategies are also often heavily weighted towards bond proxy sectors like utilities and consumer staples, making them more susceptible to the negative effects of rising interest rates.
The Harbor Dividend Growth Leaders ETF (GDIV)
We believe GDIV offers several advantages that make it particularly appealing for gaining access to dividend growth leaders across the market cap spectrum. GDIV is actively managed and subadvised by Westfield Capital, a specialist manager that brings a fundamental growth mindset towards dividend investing.
- Income & Growth Potential:
The investment team seeks to invest in companies with growing dividend streams with equity upside participation during periods of market advances and improved downside support during market declines. - Experienced & Tenured Team:
Continuity and experience of senior team ensures a repeatable process over time. The portfolio manager is supported by career sector analysts with deep domain expertise across the capitalization spectrum. - Growth-at-a-Reasonable-Price:
Westfield employs a Growth-at-a-Reasonable-Price (GARP) investment style by seeking to invest in companies with underappreciated earnings growth trading at reasonable valuations, believing stock prices will ultimately follow earnings growth.
Why Harbor Dividend Growth Leaders ETF (GDIV) Now?
Within a backdrop of tighter financial conditions and slower economic growth, many investors remain concerned about the implications of potential recession toward the end of 2023. Stocks with a history of dividend growth and which have performed relatively well during contractionary phases of the economic cycle, we believe could present a compelling investment opportunity in today’s uncertain and volatile environment.
Taking an Active Approach
An environment of enhanced volatility and wider dispersion may provide greater opportunity for active management to outperform. We believe dividend growth investors should take an active approach and leverage a skilled manager to unlock value and navigate uncertain markets.
Within the dividend growth space, many strategies and managers may rely on strict rules pertaining to dividend growth duration2, as well as hard coded quantitative screening criteria. Conversely, Westfield Capital believes in- depth fundamental research is critical in terms of getting to know management teams and assessing their commitments to paying and increasing dividends. As such, GDIV may invest in companies that recently reinstated dividends with strong management commitment to growing them over time. This enables an expanded opportunity set versus asset class convention given GDIV’s more active and fundamental approach in uncovering opportunities within the dividend growth space.
2 Duration is the weighted average number of years until the cash flows from an investment are received.
Portfolio Implementation
Dividend growth strategies such as GDIV can be used in a variety of ways within a portfolio, most notably as a core equity strategic holding, a fixed income alternative or a tactical overweight.
One potential benefit of adding dividend growth to a portfolio is its diversification qualities. In the example below, the correlation of excess returns versus the broad market (S&P 500) between growth and dividend growth equities has been negative over the past 10 years (-0.35). Conversely, the correlation of excess returns between value and high dividend equities has been positive and relatively high (0.73). For clients seeking only one dividend-oriented strategy for inclusion within a diversified portfolio, dividend growth is likely a stronger diversifier.
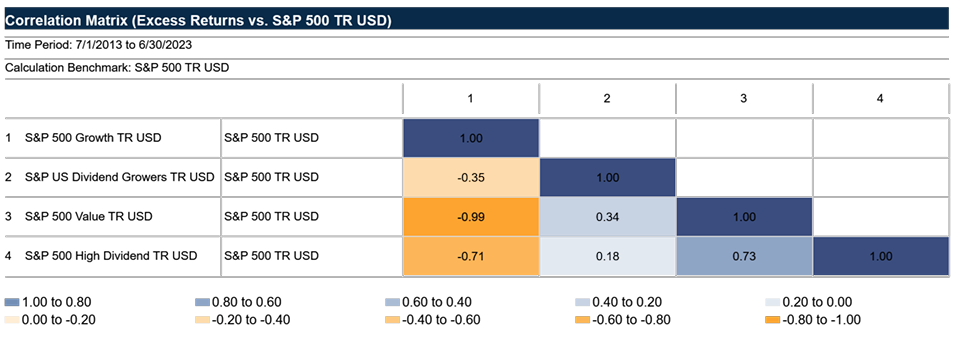
The S&P 500 Index is an unmanaged index generally representative of the U.S. market for large capitalization equities. This unmanaged index does not reflect fees and expenses and is not available for direct investment.
The S&P 500 Growth Index is a subset of the S&P 500 Index, generally representative of U.S. large capitalization growth equities.
The S&P U.S. Dividend Growers Index is designed to measure the performance of U.S. companies that have followed a policy of consistently increasing dividends every year for at least 10 consecutive years. The index excludes the top 25% highest-yielding eligible companies from the index.
The S&P 500 Value measures the ratios of book value, earnings, and sales to price. It divides the complete market capitalization of each parent index into growth and value segments.
The S&P 500 High Dividend Index serves as a benchmark for income seeking equity investors. The index is designed to measure the performance of 80 high yield companies within the S&P 500 and is equally weighted to best represent the performance of this group, regardless of constituent size.
Explore GDIV
Harbor Dividend Growth Leaders ETF (GDIV)
(866) 313-5549 (Institutional Service Desk) | HarborCapital.com | info@HarborCapital.com | Find your Sales Rep
Free cash flow represents the cash a company can generate after accounting for capital expenditures needed to maintain or maximize its asset base.
The S&P 500 Index is an unmanaged index generally representative of the U.S. market for large capitalization equities. This unmanaged index does not reflect fees and expenses and is not available for direct investment.
The ISM manufacturing index is a monthly indicator of U.S. economic activity based on a survey of purchasing managers at more than 300 manufacturing firms. This unmanaged index does not reflect fees and expenses and is not available for direct investment.
Duration is a commonly used measure of the sensitivity of the price of a debt security, or the aggregate market value of a portfolio of debt securities, to change in interest rates. Securities with a longer duration are more sensitive to changes in interest rates and generally have more volatile prices than securities of comparable quality with a shorter duration.
Important Information
The views expressed herein are those of Harbor Capital Advisors, Inc. investment professionals. They may not be reflective of current opinions, are subject to change without prior notice, and should not be considered investment advice.
Investors should carefully consider the investment objectives, risks, charges and expenses of a Harbor fund before investing. To obtain a summary prospectus or prospectus for this and other information, visit harborcapital.com or call 800-422-1050. Read it carefully before investing.
Investments involve risk including the possible loss of principal. There is no guarantee the investment objective of the Fund will be achieved. The Fund's emphasis on dividend paying stocks involves the risk that such stocks may fall out of favor with investors and underperform the market. There is no guarantee that a company will pay or continually increase its dividend. The Fund may invest in a limited number of companies or at times may be more heavily invested in particular sectors. As a result, the Fund's performance may be more volatile, and the value of its shares may be especially sensitive to factors that specifically effect those sectors. The Fund may invest in foreign securities which may be more volatile and less liquid due to currency fluctuation, political instability, government sanctions, social and economic risks. Foreign currencies can decline in value and can adversely affect the dollar value of the fund.
Diversification does not assure a profit or protect against loss in a declining market.
Investing involves risk, principal loss is possible. Unlike mutual funds, ETFs may trade at a premium or discount to their net asset value. The ETF is new and has limited operating history to judge.
Indices listed are unmanaged and do not reflect fees and expenses and are not available for direct investment.
Westfield Capital Management, L.P. is the subadvisor for the Harbor Dividend Growth Leaders ETF
Foreside Fund Services, LLC is the Distributor of the Harbor ETFs.


