 Contact
Inflation: Slowing, But Far From Slow
March 03, 2022


Executive Summary:
- A stagflation scenario like the 1970s is improbable. We maintain this view as the three key drivers of the 1970s stagflationary event do not currently exist:
- significant U.S. Dollar (USD) depreciation
- oil embargoes
- a lack of central bank inflation-fighting credibility which allowed inflation expectations to become unanchored.
- We do not expect the same degree of disinflation that we experienced post- Global Financial Crisis (GFC) for the following reasons:
- significant deficit spending has already buoyed consumer incomes throughout the recession of 2020.
- the energy transition to a more sustainable future will continue to limit new supply and thus lead to more volatile energy prices.
- stakeholder capitalism could be a driver of wage inflation.
- banks and consumers both have very strong balance sheets today and the capacity to introduce more debt into the system. This stands in stark contrast to the post-GFC cycle where both banks and consumers were deleveraging and therefore restricting the growth of credit, which is typically a key driver of sustainable inflation.
- For these reasons, we think inflation will run far below current levels, but also run above last cycle’s depressed levels for the next several years, likely in the low 2-3% range.
Inflation is omnipresent these days. It dominates market conversation, headlines mainstream media, and is driving higher prices at the gas pump and the dinner table. In fact, according to Google Trends, searches related to the term "inflation" are at all-time highs, using data compiled over nearly twenty years.
The Bureau of Labor Statistics' Consumer Price Index (CPI) has accelerated rapidly over the last twelve months, now sitting north of 7% - registering one of its highest readings since the 1970s. Not so coincidently, the chatter of 1970s stagflation, a period of weak economic growth and high inflation, is now infiltrating market discourse.
Since the 1960s, the United States experienced a period of very high inflation from 1973-1982, and subsequently, a prolonged period of disinflation. We explore some of the main drivers of these inflationary and disinflation periods, and dive into what we expect for this cycle.
Stagflation of the 1970s
The 1970s decade was a unique period in the history of the United States. The economy defied the prevailing economic wisdom that there always existed an inverse relationship between inflation and unemployment. A confluence of factors during the 1970s; however, led to persistently high inflation commensurate with stagnant growth and elevated unemployment. These influences were numerous and varied including fiscal and monetary policies, exogenous shocks, and currency devaluations.
Energy Price Shocks and Oil Embargos
Supply-side shocks played a prominent role in the inflationary experienced during the 1970s. Following the surprise attack on Israel by Egypt and Syria on Yom-Kippur in 1973, the Nixon administration backed Israel with economic and military support. In retaliation, the Organization of Petroleum Exporting Countries (OPEC) vowed to increase the price of oil. OPEC's member states agreed to cut production by 5% in October 1973 and then 5% every month thereafter until their economic and political objectives were met. A production cut of 5% per month over 12 months would have cut Arab oil supplies cumulatively by 50%.
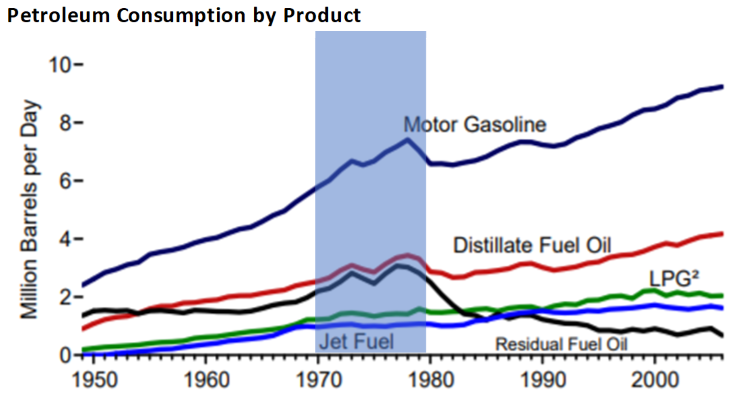
The Nixon administration attempted to institute policies to lessen the impact of the oil embargo. The administration announced the Emergency Petroleum Allocation Act, which gave federal control over the price, production, and marketing of oil & gas, and at times gasoline rationing. Likewise, Henry Kissinger, the National Security Advisor at the time, announced Project Independence, designed to make the U.S. less dependent on foreign oil. As seen in the Consumption by Product chart below, the oil embargo came at the worst possible time, when U.S. oil utilization was at record levels and dependent on foreign sources.
The conflict ultimately came to a resolution in March 1974 after Israel agreed to pull out of Arab territories following multi-lateral talks. However, oil prices quadrupled from $3 per barrel to $12 per barrel. Given that energy prices are a key input for most businesses, Americans experienced rapidly expanding prices. Later in the decade, a second oil shock occurred on the back of the Iranian Revolution, which curtailed supplies and saw oil prices more than double from $15 per barrel to over $30 at its peak. The Refiner Acquisition Cost chart below shows that it took over two decades before these prices would be seen again when adjusted for inflation.
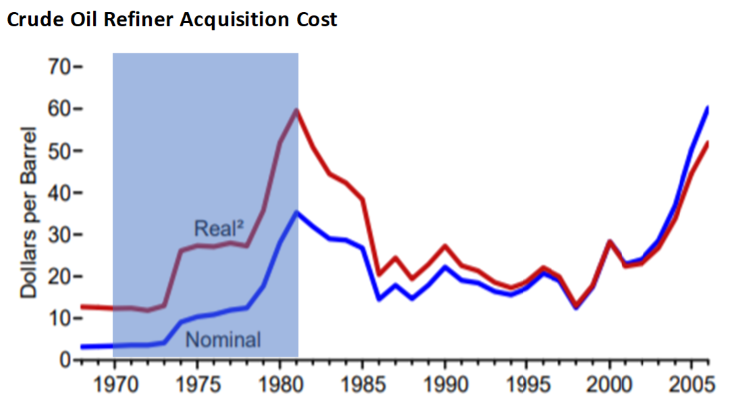
Source: EIA Annual Energy Review 2006
Currency Devaluation and the Bretton Woods System
Another monumental moment of the 1970s was President Nixon's decision to take the U.S. off the gold standard in August 1971. Following WWII, the United States was a global superpower and possessed most of the world's gold reserves. As a result, in 1944 there was a global agreement that the USD would be the world's reserve currency and pegged to gold. Currencies of other countries would then be pegged to the dollar and converted into gold at an exchange rate of $35 per ounce. This system became known as the Bretton Woods System.
The Bretton Woods system worked well for two decades as the Western European and Japanese economies rebuilt following the war and began to thrive. However, by the mid to late 1960s, concerns started to percolate that too many dollars were in the system at the same time the stock of gold in the U.S. was dwindling. Meanwhile, federal spending was increasing to finance the Vietnam War and domestic social programs. Countries such as France, Great Britain, Japan, Korea, and others became concerned that the dollar was overvalued and began exchanging dollars for gold. The fear that there were now more dollars in existence than could be backed by U.S. gold reserves put massive downward pressure on the dollar's value. From the late 60s to the early 70s, the dollar devalued by 25%, causing significant price inflation as the cost of imports priced in foreign currencies suddenly surged.
During this time, President Nixon gathered his top economic advisors at Camp David to devise a plan to stop the run on U.S. gold reserves, stabilize the dollar, and combat inflation. The economic team unanimously agreed in August 1971 that de-pegging the dollar to gold was extreme but the only viable option. That decision was pitched to the American people as a temporary measure to stop "speculators" from destroying the dollar but ultimately led to the fiat monetary system with free-floating currencies we have today. Later in the decade, under the free-floating system, the dollar would once again depreciate by more than 20% due to fundamental economic reasons – high inflation and unemployment. This highlights the self-reinforcing dynamic that pervasive inflation can have: a weakening currency leads to inflation, and inflation without central bank intervention leads to a weakening currency.
Inflation Expectations
In addition to increased deficit spending and de-pegging the USD from gold, monetary policy also contributed to higher inflation. The predominant economic theory of the time insisted that unemployment and inflation moved in opposite directions - the Phillips Curve. However, less attention was paid to the importance of expectations of prices in fueling inflation. At the beginning of the 1970s, the unemployment rate declined as the money supply grew and interest rates fell. Inflation started to increase rapidly as the combination of loose monetary policy and government spending compounded the effects of the supply shocks. Once expectations for higher inflation became entrenched, it would prove difficult to dislodge (see chart on next page). Expectations were adopted into wage negotiations for workers, which led corporations to respond with higher prices, fueling a cost-price spiral. Eventually, the high inflation levels began to create distortions in the real economy, leading to higher unemployment and higher prices, a combination known as stagflation.
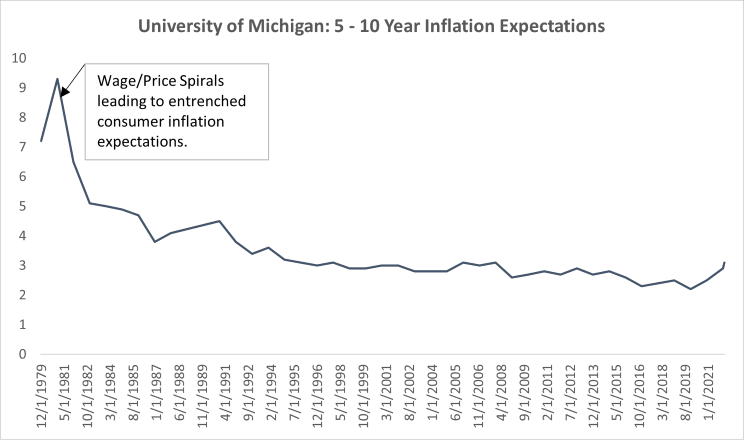
Source: Harbor Multi-Asset Solutions, Bloomberg, University of Michigan
What Goes Up, Must Come Down – The Federal Reserve (Fed) Takes a Stand
In 1979, under President Jimmy Carter, Paul Volcker took over as Chairman of the Fed. Prior Fed presidents were hesitant to tighten policy as unemployment was elevated throughout the 1970s. Under Volcker's leadership, the Fed took drastic measures to tame the high level of inflation. It became clear that loose Fed policy was part of the problem, not the solution. High unemployment was stemming from egregious levels of inflation leading to demand destruction. The Federal Funds rate, the rate at which banks lend to each other overnight and the Federal Reserve's target interest rate, increased to 20%. By drastically raising interest rates, the economy fell into a recession in the early 1980s. Volcker remained steadfast; however, with his objective being to lower the demand for and supply of credit, thus slowing aggregate demand and therefore price inflation. Volcker's restrictive monetary policy was sufficient to ultimately reign in the pernicious bout of inflation, restore Fed credibility, and by extension curb inflation expectations.
Drivers of Secular Disinflation: Globalization, Disruptive Innovation, Demographics
With the Federal Reserve firmly controlling its price stability objectives, the Great Moderation began. Alongside monetary policy, several secular themes supported the slower growth of prices - including changing demographics, interconnected global economies, and technological advancements. These secular shifts were a tailwind to the Fed's credibility on inflation targeting, which brought about the disinflationary environment of the modern era.
Globalization and technology are two long-term shifts that impact the economy's supply side by increasing productivity and lowering the cost to produce. The global economy has also become more interconnected with more optimized supply chains, particularly after China entered the World Trade Organization (WTO) in 2001. As the world's economy was globalized, it increased competition. In addition to more flexible prices from competitive dynamics, globalization also shifted manufacturing goods to regions with lower labor costs. The movement of production overseas increased trade deficits in the U.S., but also lowered costs for the U.S. consumer.
Similarly, disruptive innovation has had a deflationary impact on prices. Technology, despite massive research and development budgets, is deflationary. The innovation economy’s product cycles are extremely short; today's hot product is obsolete tomorrow. As a result, consumers and businesses alike have benefited from enhanced next- generation products at similar or lower prices. The chart below shows how the efficiency of computing has increased exponentially and therefore reduced the cost of computation.
Decrease In the Cost of Computing
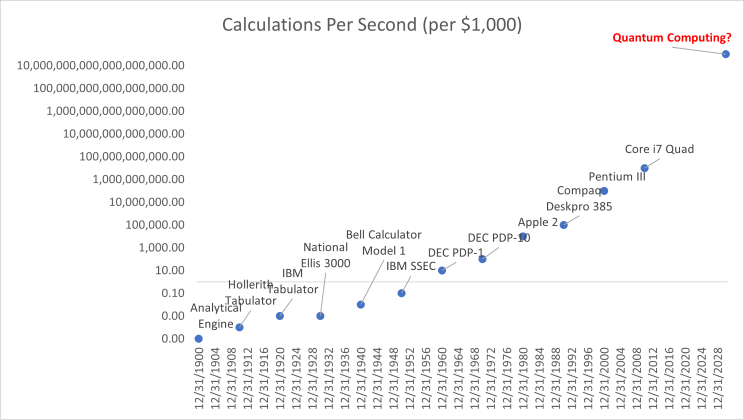
Source: Harbor Multi-Asset Solutions
Additionally, increased automation has boosted productivity, allowing companies and labor to be more efficient. These innovation-driven productivity gains have reduced costs and therefore prices for the end consumer. The combination of globalization and technological disruption has favored capital at the expense of labor in the means of production.
Demographics have also been a driver of disinflation. Populations around the globe are aging, people are living longer, and the growth rate in the labor force continues to fall. These demographic trends aid in keeping price gains low as workers save more for longer retirements (saving more for later results in consuming less now), and the older population must support themselves for an extended period beyond their income-generating years. These demographics have catalyzed a secular decline in the employment to population ratio as well as potential real GDP growth. The latter is highly correlated to inflation, and the former is highly correlated to the neutral rate. The combination of lower consumption and higher savings reduces price pressures.
Cyclical Drivers of Disinflation: Indebtedness and Deleveraging Amongst Banks and Consumers
In the short term, taking on additional debt supports aggregate demand and is therefore inflationary; however, debt ultimately pulls forward future demand and must be paid back with interest. If debt burdens grow too large, then the result is lower future demand resulting in slower growth and therefore lower inflation.
Following the GFC, governments took on sizeable amounts of debt, much of which was purchased by the Fed. As such, investors speculated that the expansionary effect of the Fed's unconventional actions, Quantitative Easing (Q.E.), would be inflationary. However, higher prices never occurred, and the Fed found themselves fighting against secular disinflationary pressures instead.
Ben Bernanke's Fed implemented Q.E. to stimulate the economy further and save it from financial depression. The actions undertaken were necessary because the Fed's usual tool to stimulate growth, the short-term interest rate, was already at the zero-lower bound. While the Fed expanded the size of its balance sheet and the monetary base under Q.E., it was not inflationary in the traditional sense.
Source: Harbor Multi-Asset Solutions
Source: Federal Reserve
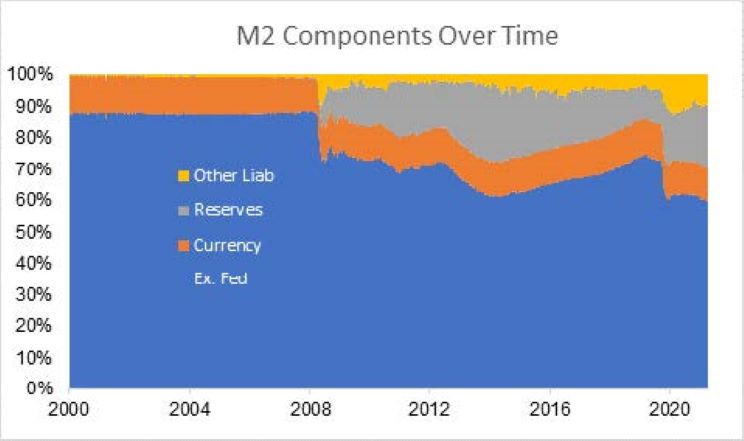
*M2 is a calculation of the money supply that includes all elements of M1 as well as "near money." M1 includes cash and checking deposits, while near money refers to savings deposits, money market securities, and other time deposits (in amounts less than $100,000).
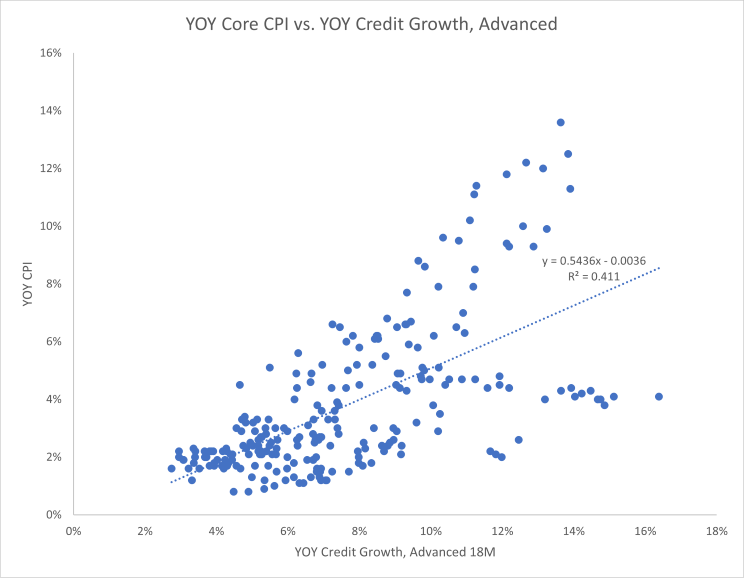
Q.E. is simply an asset swap between banks and the Fed. Banks swap treasuries they hold on to their balance sheet in exchange for reserves (deposits that banks hold at the Fed). During the GFC, the expansion of the monetary base never made it out of the financial system and into the real economy because banks were recapitalizing to meet tighter regulatory controls amid broader deleveraging and therefore were less willing to increase the supply of loans. Similarly, consumers were deleveraging following the housing crisis and therefore less willing to demand new loans. Consequently, bank reserves with the Fed grew significantly, driving the growth in the money supply (M2); however, true private sector credit was growing below trend and thus inflationary pressures were never unleashed. The scatter plot on the left shows that growth in credit leads inflation by more than18 months and has a fairly strong relationship. Credit growth in the U.S. economy averaged just 4.0% per year from 2009 through 2019 vs. 8.5% from 1960 to 2007.
History Does Not Repeat, But It Does Rhyme
Thus far, we have looked back at history and explored the drivers of inflation and disinflation over the last half-century. As investors, we must look out on the horizon and ask ourselves, “what looks similar to past cycles, and what looks different?”
Source: Federal Reserve
Studying periods of high inflation such as the American and United Kingdom economies in the 1970s, or periods of hyperinflation such as post-World War I Germany, a few variables appear to recur – increased deficit spending (another form of growing the supply of money), expansive monetary policy, supply-side shocks, and currency devaluations. Looking out on the investment horizon and beyond, certain events do indeed rhyme.
In the late 1960s, America increased deficit spending to support the Vietnam War, and in the 1920s, Germany's Weimar Republic borrowed heavily to pay for the First World War. In many respects, and certainly in the United States, the governmental response to the global Covid-19 health crisis was analogous to wartime, but the “enemy” looked much different. Much of the economy's supply-side shuttered and manufacturing switched to support the effort and provide needed supplies (PPE and medical equipment). The government took on massive deficits to help those impacted the most in the fight, its citizens.
In response to the global pandemic, the U.S. increased its debt as a percentage of GDP to more than 100%. The government's response was extraordinary, stepping in to bail out impacted industries, making forgivable loans to small and medium-sized businesses, providing citizens with stimulus checks, and augmenting unemployment benefits for those who lost their jobs. As a result of these measures, consumer nominal incomes actually rose during the recession which is a highly abnormal occurrence. These actions were unprecedented and supported the demand side of the economy.
Unlike Q.E., which printed money and injected it into bank reserves with the Fed, the Covid-19 crisis fiscal deficit spending (“money printing”) was injected directly into the real economy via the consumer, which has a more direct impact on aggregate demand.
Let’s provide some context for the massive quantity of fiscal stimulus that we experienced since Q1 of 2020: fiscal stimulus since the onset of the recession has totaled $5.6 trillion. The nominal size of the U.S. economy was $25.0 trillion in 2019. The amount of fiscal stimulus therefore amounted to 22.4% of GDP. The Congressional Budget Office (CBO) projects that potential real GDP growth is 1.8% in the U.S. This means that 12.4 years of GDP growth worth of stimulus was injected into the economy since the start of 2020.
At the same time, companies worldwide took out their recessionary playbooks and cut inventories, reduced orders, and lowered costs by laying off or furloughing employees. However, because the demand side coffers were full, the economy's supply-side was caught off guard as the economy reopened. As a result, supply chains struggled to keep up with demand, bottlenecks ensued, and price increases intensified.
Unintended Inflationary Consequences of ESG
Environmental, Social, and Governance (ESG) trends have taken society and the investment world by storm since the rollout of the United Nation's Sustainable Development Goals (SDGs) in 2015. The U.N. SDGs are 17 broad- based objectives to achieve a better and more sustainable future for all. Stemming from these objectives, more companies have been signing on to these principles, setting carbon reduction goals, and moving away from maximizing shareholder profits to stakeholder capitalism. All stakeholders (employees, customers, and suppliers) are accounted for in this system.
While these altruistic goals may increase efficiencies, lower cost, and increase productivity longer-term, they could prove inflationary in the short- to medium-term. Governments and companies have been rolling out aggressive targets related to carbon reduction. As companies scramble to reduce their carbon footprints, it requires expanding research & development budgets and retrofits to reduce the carbon intensity of current operations. Furthermore, wage pressures are likely to be born out of stakeholder capitalism. Employees will share more profits and have more bargaining power, reversing the trend over prior decades that favored capital over labor.
Moreover, corporate social responsibility is likely to lead to further regulation and reporting requirements. The new demands will require companies to hire staff and create new processes. These increased business costs are likely to be passed on to the end consumer.
There is a timing mismatch in the handoff from the old "brown" economy to the new "green" economy that will support higher energy prices over the intermediate-term as well. Higher prices are partially due to carbon-based energy producers facing pressures from traditional funding sources (banks and capital markets), which has increased their cost of capital. As such, energy companies have drastically reduced their capital expenditures, pulled back on growth initiatives, and reduced supplies. At the same time, alternative energy sources such as wind and solar are less energy-efficient today and come with reliability and redundancy issues.
Massive investments will be required to improve alternative energy technologies and adapt existing electrical infrastructure. The demand from electrification will lead to a short supply of critical commodities and components. Freeport - McMoRan is one of the world's largest miners of copper, an essential element for the electrification transition. On a recent earnings call, Chairman and CEO Richard Adkerson talked at length about how the energy transition will cause the world to be structurally short of copper. These supply/demand imbalances could lead to more frequent energy shocks and increased price volatility. We have seen this trend in recent months in Europe and Asia, where at times energy rationing has been required. The imbalances in place through the transition period could result in sustained higher energy costs.
Harbor at the Helm
We believe that a stagflation scenario similar to the 1970s is extremely unlikely. We maintain this view because the following three key drivers of the 1970s stagflation do not currently exist:
- significant USD depreciation
- oil embargoes
- lack of central bank inflation fighting credibility that allowed for inflation expectations to become entrenched
The USD depreciated more than 30% against other major currencies over the 1970s decade as Nixon exited the Bretton Woods accord, effectively eliminating the gold standard; oil prices rose from $3.00/barrel to $30.00/barrel from 1970-1982 on the back of an OPEC oil embargo and a separate oil embargo from Iran. Lastly, inflation became entrenched in expectations as few consumers and market participants expected the Fed to take the necessary measures to curb inflation given the recessionary implications of said measures. None of these preconditions exist today.
However, similar to the absence of the preconditions of the 1970s for inflation, there is also an absence of most of the preconditions of the post-GFC cycle regarding disinflation. Therefore, while we do not see a return to the inflationary backdrop of the 1970s as probable, we also do not think a return to the same level of disinflation as the post GFC cycle is probable. Specifically, significant deficit spending has already buoyed consumer incomes throughout the recession of 2020. We also believe the energy transition to a more sustainable future will continue to limit new supply and thus lead to more volatile energy prices.
Stakeholder capitalism could contribute to wage inflation, which tends to be persistent shifting forces back in favor of labor over capital. Lastly, banks and consumers both have very strong balance sheets today and have the capacity to introduce more debt into the system. This stands in stark contrast to the post-GFC cycle where credit impulses were restricted. A stronger credit impulse alone should allow inflation to run above post-GFC cycle levels.
At the same time, longer term secular disinflationary trends are reversing course in favor of inflation. For instance, we expect manufacturing capacity to shift onshore (de-globalization), prioritizing just-in-case inventories rather than just-in-time which requires moving production closer to the end consumer. The implication of this is not trivial as the cost of production would increase, but also create a more resilient supply chain. This higher cost would inevitably be passed along to consumers in the form of higher prices.
Furthermore, the Fed adopted a new flexible average inflation targeting framework that signaled their intention to prevent the disinflation that followed the GFC. Given the credibility the Fed now has relative to the 1970s, we believe long term inflation expectations are likely to anchor close to 2.0%
For these reasons, we think inflation has the potential to run above last cycle’s depressed levels, and likely above 2.0% for some time. While we hesitate to provide a point estimate for inflation 12-24 months from now given the challenging backdrop for forecasting prices, we think a reasonable assumption is for core inflation to drop back down to more than 2.5-3.5%. Certainly, there are significant implications for markets if inflation settles down toward the bottom vs. the top of that range, but we will need to wait and see what the new inflation run rate is. We think that will become more evident in the second half of 2022.
For now, the results of our analysis indicate that it is prudent to remain overweight equities as we expect inflation to drop meaningfully from current levels and thus the Fed will not have to fight inflation aggressively and end the expansion. Within equities, we think it is reasonable to be balanced between growth and value at this time. Valuation spreads have returned to the long-term average, and the pandemic driven value trade has now been exploited.
However, inflation running north of last cycle will benefit companies that are price takers rather than price setters and generate more of their value in near-term cash flows. We therefore maintain a neutral view on value stocks. Higher real rates are also likely to act as a headwind to growth stock multiples; as a result, EPS growth will be a much more important driver. Although rising real rates remain a headwind for growth stocks, we believe that as inflation recedes from current levels, worries about an aggressive tightening cycle will also recede and sentiment around growth stocks will improve. We therefore also remain neutral on growth stocks and prefer a balance across styles. Within fixed income, we remain underweight duration as we believe the Fed is far behind the curve and interest rates will continue to move higher as the Fed tightens in an attempt to bring inflation back down closer to 2.0%.
For more information, please access our website at www.harborcapital.com or contact us at 1-866-313-5549.
Legal Notices & Disclosures
The views expressed herein are those of Harbor Capital Advisors, Inc. investment professionals at the time the comments were made. They may not be reflective of their current opinions, are subject to change without prior notice, and should not be considered investment advice. The information provided in this presentation is for informational purposes only.
Performance data shown represents past performance and is no guarantee of future results.
Investing entails risks and there can be no assurance that any investment will achieve profits or avoid incurring losses.
Harbor Capital Advisors, Inc.


