 Contact
Mapping the Business Cycle
Harbor Multi-Asset Solutions: Q2 2024
April 17, 2024

.webp)
Macro Landscape: Q2 2024
Catching Some Breadth
- Consumer spending is beginning to slow; however, growth is broadening as housing, the manufacturing sector, and lending are emerging from the doldrums of the last two years.
- The case for 2 percent inflation hinges on three assumptions: goods prices either deflating or holding constant, shelter inflation catching down to slowing rent prices from late-’22 through 2023, and services price gains slowing further. Progress on all three stalled during Q1. There are reasons to discount January and February inflation, but a tight labor market leaves inflation risks tilted to the upside.
- To paraphrase a member of the Federal Reserve (Fed), without overreacting, investors and committee members reacted to the inflation surprise by assuming a more gradual pace of rate cuts. The June Federal Open Market Committee (FOMC) meeting may still be the Fed’s first rate cut, but risks are skewed towards a later start and fewer than the 3 cuts priced.
- Increased breadth in the economy may lead to the same for the equity market. Sectors and areas of the equity market more exposed to the manufacturing cycle like energy and small caps outperformed in March. There have been several false starts for a shift in leadership beyond tech, but economic tailwinds coupled with a handful of “risk management” cuts from the Fed may finally catalyze a broadening.
- A late-cycle environment and simmering geopolitical tensions are keeping commodities top of mind. Gold remains an excellent diversifier amid salient inflation and the potential for geopolitical conflict to escalate. Parts of the broader commodity complex like copper or oil also offer compelling options to diversify traditional equity and fixed income portfolios.

Tactical Asset Allocation & Market Themes
| Unconstrained vs. 60/40 | Chg | Underweight | Neutral | Overweight | Rationale |
| Portfolio Risk (Beta, Relative Vol) | • | Retain equity overweight as U.S. expansion continues and gains accrue to a larger share of companies | |||
| Portfolio Duration | • | Maintain duration underweight as inflation risks remain more salient than growth concerns | |||
| Equities (ACWI) | • | Late cycle regime with positive market sentiment has typically been a favorable environment for equities | |||
| U.S. Large Cap | • | Higher profitability of US large cap companies has been attractive in a late cycle environment | |||
| US SMID Cap | • | Valuations appear attractive but maintain neutral positioning due to low quality nature in the aggregate | |||
| Western Europe | • | Growth remains stalled, inflation is declining, a manufacturing revival may be necessary to see higher returns | |||
| Japan | • | Attractive valuation, improving corporate governance, and gradual policy normalization supportive of risk | |||
| Emerging Markets | • | Valuations appear attractive, global manufacturing cycle has turned higher, but awaiting more policy certainty | |||
| Equity Styles1 | |||||
| Value | • | Selectively leaning into attractive value sectors, but overall tight value spreads have been a headwind to the style | |||
| Growth | • | Beneficiary of peak rates & inflation; however, valuations have normalized and thus we prefer quality/GARP | |||
| Quality | • | Favor companies that maintain pricing power and generate high levels of profitability | |||
| Low Vol | ↓ | • | We believe it is still too early to lean into defensives given the broader resilience of the economy | ||
| Fixed Income (Barc Agg) | ↓ | • | |||
| Treasury | • | Treasury underweight reflects better opportunities in IG and MBS for quality exposures | |||
| IG | ↓ | • | While rich to MBS, IG credit risk more conservatively priced than HY or equity markets | ||
| MBS | • | MBS closing the gap to IG as rate volatility declines and Fed balance sheet plans come into focus | |||
| Credit (Non Agg) | • | Credit spreads appear to be approaching the floor, but difficult to forgo income in late-cycle regime | |||
| HY Bonds | • | HY offers low risk premia, however, carry appears to be an attractive factor in a benign macro environment | |||
| EMD | • | EM debt should diversify given divergent policy paths, albeit without significant yield pickup | |||
| Loans | • | Like HY, implied default rates in the loan market have been quite low, but carry remains attractive | |||
| Currency (USD) | • | U.S. growth exceptionalism remains supportive of the dollar, but fiscal deficits are alarming | |||
| Vs. Developed | • | U.S. policy expectations driving global monetary policy, growth convergence necessary for dollar weakness | |||
| Vs. Emerging | • | Nascent recovery in Chinese activity data should support EM risk appetite if it proves durable | |||
| Commodities | • | Gold offers diversification benefits; we expect supply deficits in 2H 2024 for energy | |||
| Precious Metals | • | Official investors accumulating gold reserves while others seek inflation-protection; strong diversification potential | |||
| Ind Metals, Agg, Energy | • | Industrial metals demand improving, energy market tightening amid OPEC supply cuts | |||
| Cash (T-Bills) | • | Cash offers an attractive yield, although we expect duration to diversify soon as inflation recedes |
1 Overall "equity styles" cannot be o/w or u/w, only individual equity styles
For hypothetical illustrative purposes only. This information should not be considered as a recommendation to purchase or sell a particular security.
Source: Harbor MAST; Positioning as of March 2024
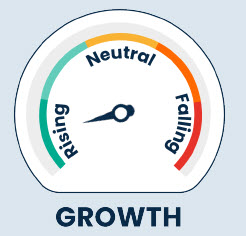
Business Cycle: Growth Conditions (G)
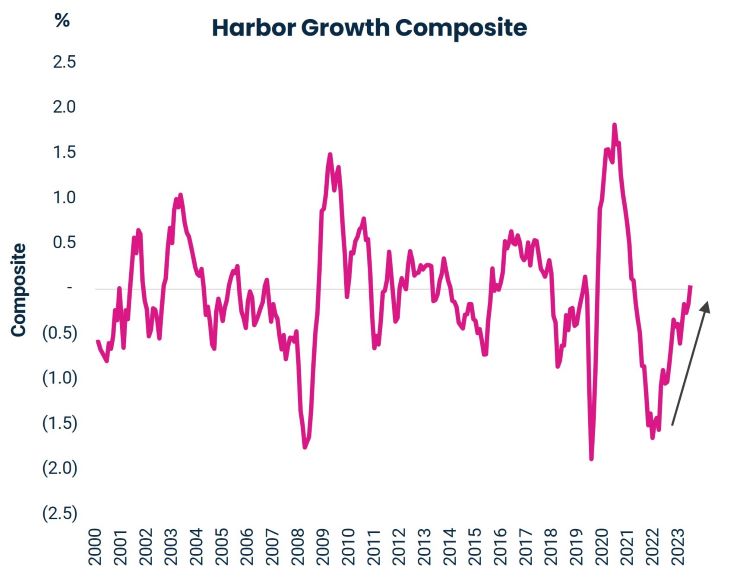
- A resurgent U.S. consumer boosted growth in H2 2023 amid high nominal income growth and elevated household net worth to draw upon. In 2024, capital-intensive sectors appear to be picking up the slack for slowing consumption growth.
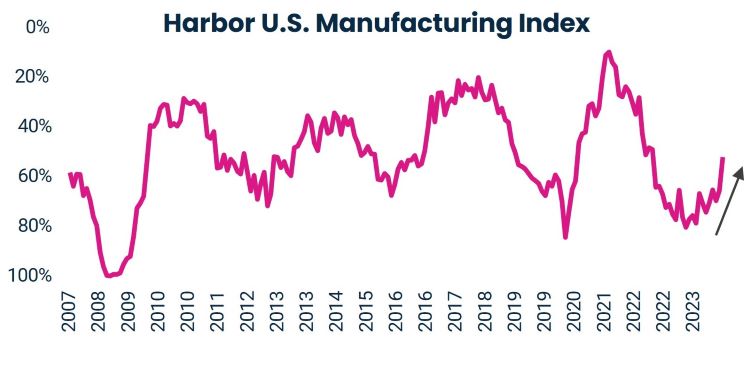
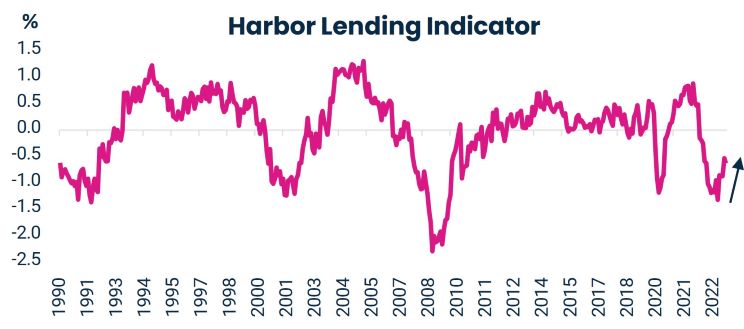
- Despite higher rates since the start of the year, the housing and manufacturing sectors are recovering.
- Looking back, higher immigration likely explains some of the unusual combination of robust growth and job gains, alongside a modest increase in the unemployment rate and slowing wage growth in 2023. Higher labor supply from both immigration and a tight labor market could support higher growth without stoking inflation concerns. The Congressional Budget Office (CBO) expects this tailwind to fade, but potential growth will remain elevated so long as it persists.
.jpg)
For more information about Harbor's indicators and models, please see the end of this page. For hypothetical and Illustrative purposes only. This information should not be considered as a recommendation to purchase or sell a particular security. Sources: Harbor MAST, Bloomberg L.P.; Data as of March 2024
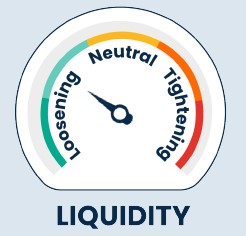
Business Cycle: Liquidity Conditions (L)
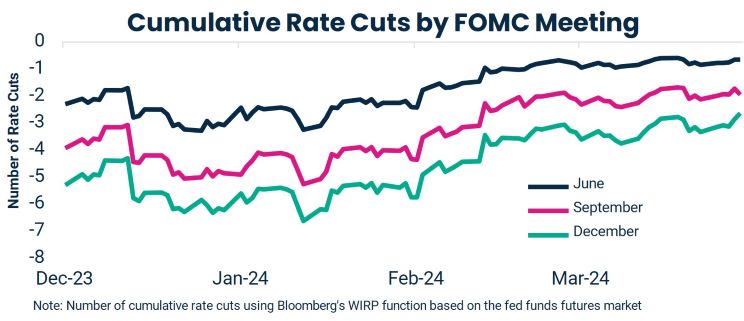
- Disinflation stalled in the first quarter leading to a shallower rate cut path.
- With the sell-off in yields, the market-implied path of policy is now closely aligned with the latest FOMC dot plot.
- Despite the inflation surprises, Chair Powell and the Committee’s intent is to reduce interest rates later this year as the prevailing belief is that the policy rate remains above its sustainable level. The debate centers on when to start and how far to go rather than whether to consider additional rate increases.
- With Japan as a notable exception, foreign central banks are poised to embark on sustained easing cycles. However, fewer rate cuts in the U.S. leave other countries vulnerable to external shocks. The risk is a strong U.S. economy may put both a high floor and a low ceiling for global growth as foreign economies must attenuate domestic policy to account for the Fed.
.jpg)
For more information about Harbor's indicators and models, please see the end of this page. For hypothetical and Illustrative purposes only. This information should not be considered as a recommendation to purchase or sell a particular security. Sources: Harbor MAST, Bloomberg L.P.; Data as of March 2024
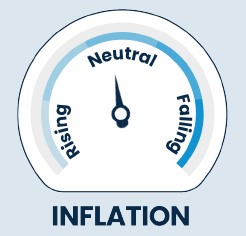
Business Cycle: Inflation Conditions (I)
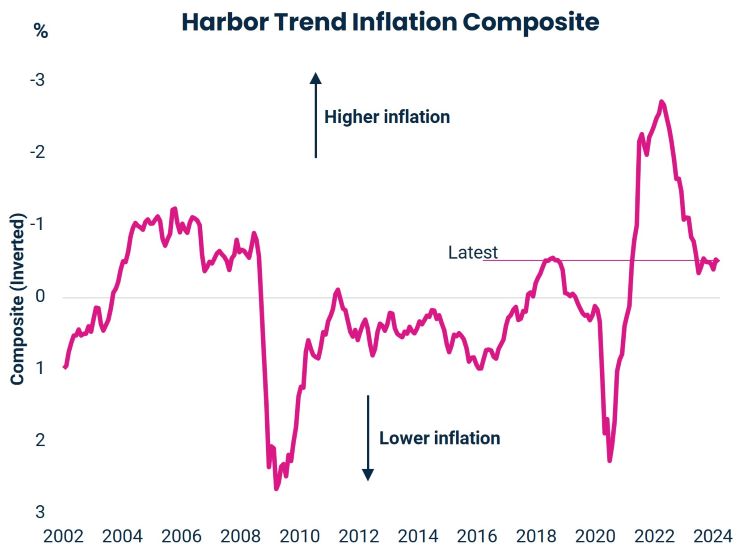
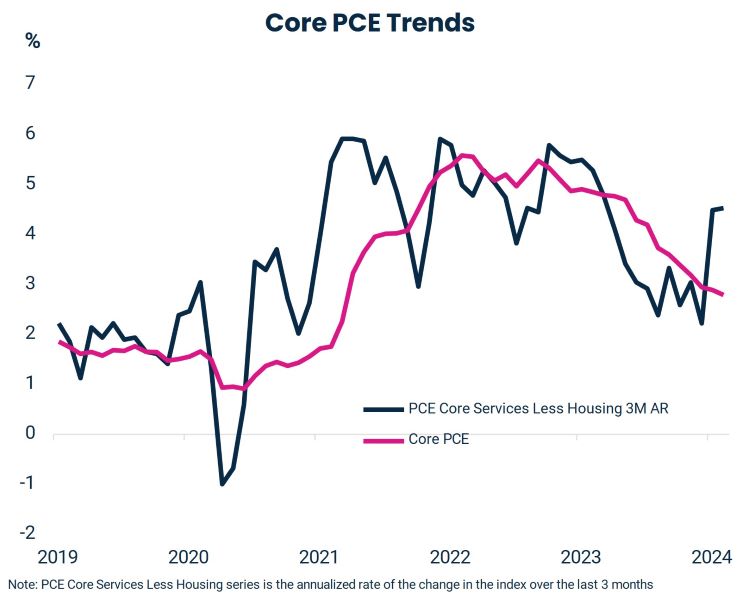
- Inflation re-accelerated in January, followed by another month of above-target inflation in February. Residual seasonality could explain some of the surprise as many firms raise wages and prices in the first two months of the year; however, our inflation models do show a slowing in the disinflation trend.
- The risk is that the strength of the U.S. economy and the easing of financial conditions since December are rekindling inflation. We think there is some evidence supporting this fear.
- Despite our optimism on the housing market going forward, shelter inflation will likely decelerate as the data incorporates rent prices on a lagged basis.
- A recovery in both the manufacturing sector and global demand is a different story. If goods price inflation turns positive, it will be difficult for the Fed to feel confident that inflation will return to 2 percent on a sustained basis without a material repricing in interest rates.
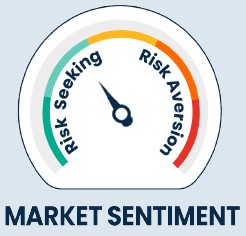
Market Sentiment
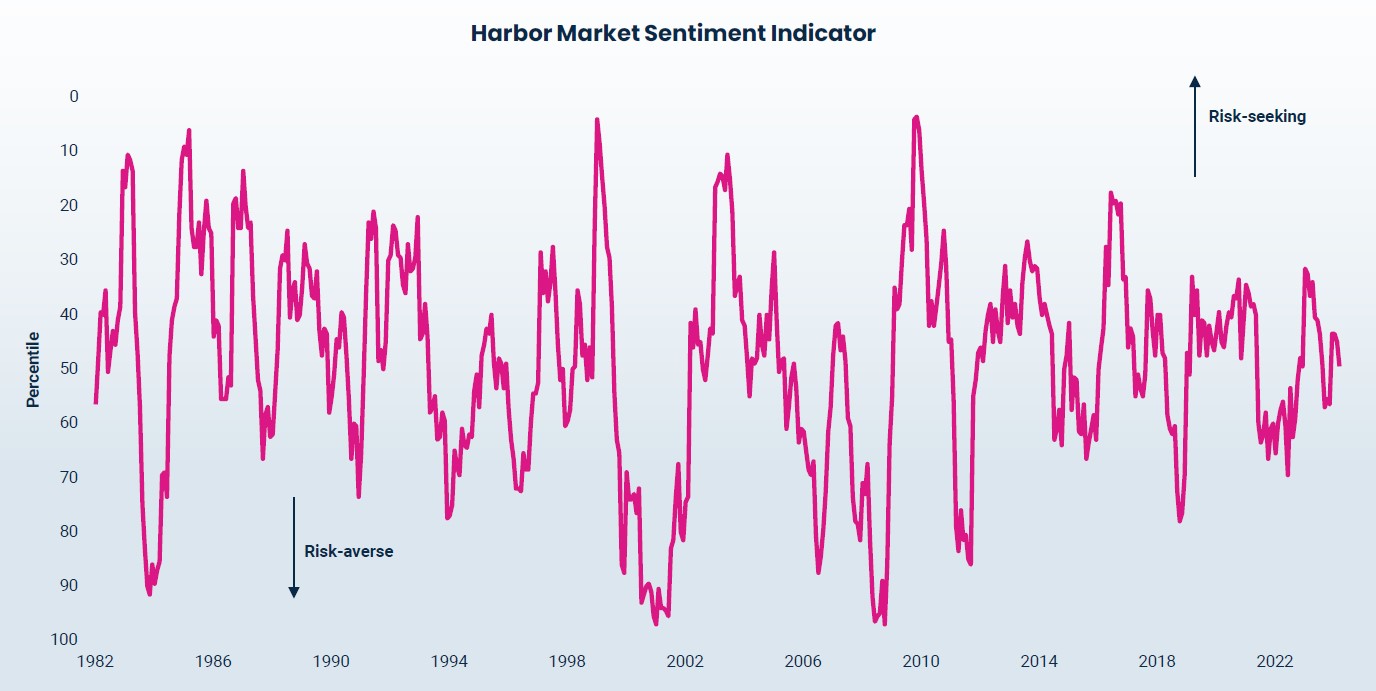
- Financial conditions have eased considerably since November of 2023 as the Fed signaled a shift to cuts this year, while at the same time growth forecasts for 2024 were revised higher.
- While far from exuberant, market internals have shifted towards more cyclical and risk-on positioning. However, we’ve seen a slight retracement in recent weeks as the disinflation story is being called into question after relatively strong January and February inflation prints.
For more information about Harbor's indicators and models, please see the end of this page. For hypothetical and illustrative purposes only. This information should not be considered as a recommendation to purchase or sell a particular security. Sources: Harbor MAST, Data as of March 2024
GLI + Market Sentiment = Business Cycle Regime
- Our Business Cycle model indicates that the U.S. economy is in a “Late-Cycle” environment. Consumption slowed in Q1 from the brisk Q4 pace, while there are nascent signs of a recovery in both the manufacturing and housing sectors.
- Market sentiment has remained “risk-seeking” since November of 2023 as upside growth surprises offset the paring back of rate cut expectations for the Fed. The risk to markets is whether the easing in financial conditions since December rekindles inflation or not.
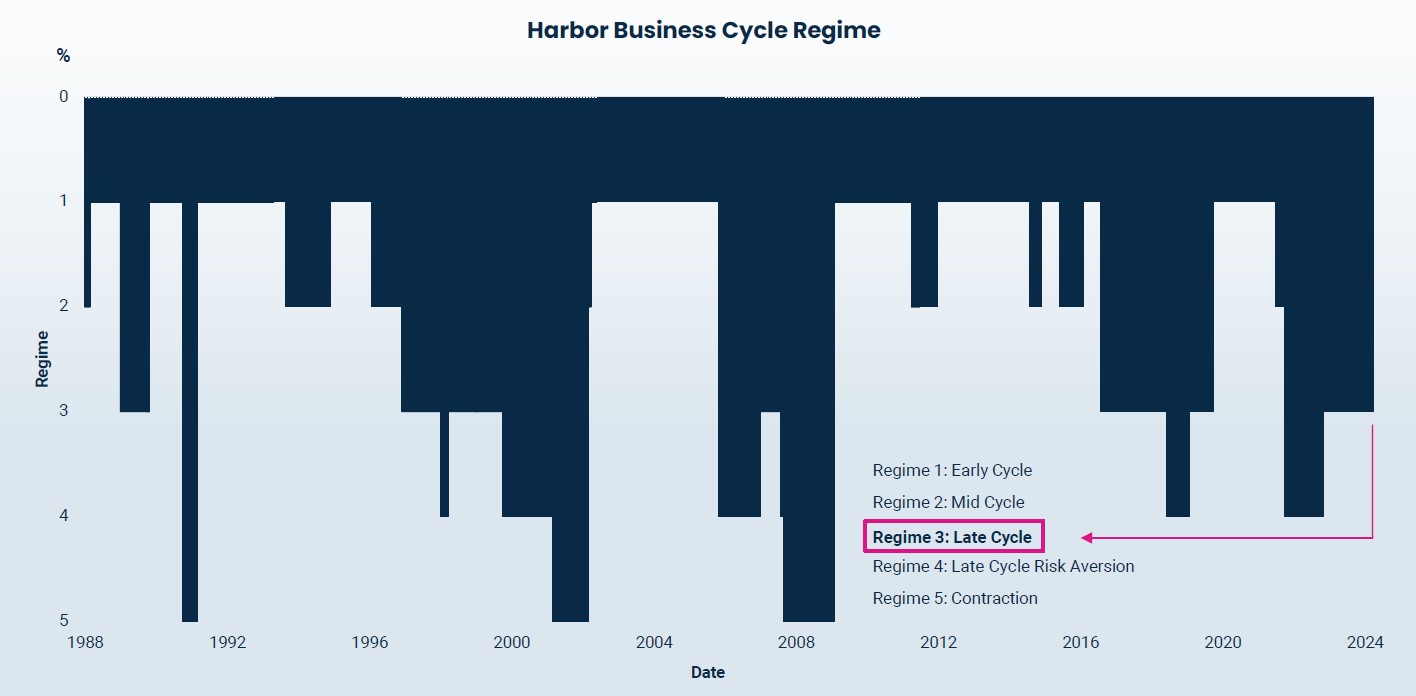
For more information about Harbor's indicators and models, please see the end of this page. For hypothetical and illustrative purposes only. “GLI” stands for Growth, Liquidity and Inflation. This information should not be considered as a recommendation to purchase or sell a particular security. Sources: Harbor MAST; Data as of March 2024
Five Regimes and Archetypal Characteristics
| Regime | Growth | Liquidity | Inflation | Sentiment |
| Early Cycle |
|
|
|
|
| Mid Cycle |
|
|
|
|
| Late Cycle |
|
|
|
|
| Late Cycle Risk Averse |
|
|
|
|
| Contraction |
|
|
|
|
For more information about Harbor's indicators and models, please see the end of this page. For hypothetical and illustrative purposes only. Sources: Harbor MAST
Harbor’s Archetypal Positioning By Regime
Cross-Asset Positioning
| Regime | Equities | Credit | Bonds | Gold | Cash |
| Early Cycle | Strong Overweight | Strong Overweight | Strong Underweight | Neutral | Neutral |
| Mid Cycle | Overweight | Overweight | Overweight | Neutral | Underweight |
| Late Cycle | Strong Overweight | Overweight | Underweight | Overweight | Neutral |
| Late Cycle Risk Averse | Underweight | Underweight | Overweight | Strong Overweight | Overweight |
| Contraction | Strong Underweight | Strong Underweight | Strong Overweight | Strong Overweight | Strong Overweight |
Intra-Equity Positioning
| Regime | Value Equities | Growth Equities | Low Vol Equities | Small Cap Equities | Large Cap Equities |
| Early Cycle | Strong Overweight | Neutral | Strong Underweight | Strong Overweight | Neutral |
| Mid Cycle | Neutral | Neutral | Overweight | Underweight | Overweight |
| Late Cycle | Underweight | Strong Overweight | Strong Underweight | Underweight | Strong Overweight |
| Late Cycle Risk Averse | Strong Underweight | Strong Underweight | Strong Overweight | Strong Underweight | Overweight |
| Contraction | Strong Underweight | Strong Underweight | Strong Overweight | Strong Underweight | Overweight |
For more information about Harbor's indicators and models, please see the end of this document. For hypothetical and illustrative purposes only. This information should not be considered as a recommendation to purchase or sell a particular security. Sources: Harbor MAST; Data as of March 2024
Important Information
The views expressed herein are those of the Harbor Multi Asset Solutions Team at the time the comments were made. They may not be reflective of their current opinions, are subject to change without prior notice, and should not be considered investment advice. These views are not necessarily those of the Harbor Investment Team and should not be construed as such. The information provided is for informational purposes only.
Past performance is no guarantee of future results.
All investments are subject to market risk, including the possible loss of principal. Stock prices can fall because of weakness in the broad market, a particular industry, or specific holdings. Bonds may decline in response to rising interest rates, a credit rating downgrade or failure of the issue to make timely payments of interest or principal. International investments can be riskier than U.S. investments due to the adverse affects of currency exchange rates, differences in market structure and liquidity, as well as specific country, regional, and economic developments. These risks are generally greater for investments in emerging markets.
Fixed income securities fluctuate in price in response to various factors, including changes in interest rates, changes in market conditions and issuer-specific events, and the value of an investment may go down. This means potential to lose money.
As interest rates rise, the values of fixed income securities are likely to decrease and reduce the value of a portfolio. Securities with longer durations tend to be more sensitive to changes in interest rates and are usually more volatile than securities with shorter durations. Interest rates in the U.S. are near historic lows, which may increase exposure to risks associated with rising rates. Additionally, rising interest rates may lead to increased redemptions, increased volatility and decreased liquidity in the fixed income markets.
Diversification does not assure a profit or protect against loss in a declining market. Indices listed are unmanaged, and unless otherwise noted, do not reflect fees and expenses and are not available for direct investment.
Investing entails risks and there can be no assurance that any investment will achieve profits or avoid incurring losses.
Certain forecasts, estimates and returns are based on hypothetical assumptions. It is for informational and hypothetical purposes only. This material does not constitute investment advice and should not be viewed as a current or past recommendation or a solicitation of an offer to buy or sell any securities or to adopt any investment strategy. The forecasts, estimates and return presented do not represent the results that any particular investor may actually attain. Actual performance results will differ, and may differ substantially, from the hypothetical information provided. There is no guarantee that any of the forecasts and projections will come to pass.
Performance indices on slide 3 are as follows: U.S. Large Cap, the S&P 500 Index; U.S. SMID Cap, the Russell 2500 Index; Western Europe, FTSE Developed Europe All Cap Net Tax Index; Japan, MSCI Japan Index; Emerging Markets, MSCI Emerging Markets Index; Treasuries, the Bloomberg U.S. Treasury Index; Municipals, the Bloomberg U.S. Municipals Index; IG Corp, the Bloomberg
U.S. Corporate Bond Index; MBS, the Bloomberg U.S. Mortgage-backed Securities Index; ABS, the Bloomberg U.S. Agg ABS Index; Euro IG, the Bloomberg Euro-Aggregate Corporates Index; EMD
($), the Bloomberg Emerging Markets Hard Currency Aggregate Index; EM IG Corp, the Bloomberg Emerging Markets Investment Grade Index; Euro HY, the Bloomberg Pan-European High Yield Index; US HY, the Bloomberg U.S. Corporate High Yield Bond Index; Leveraged Loans, the Morningstar LSTA U.S. Leveraged Loan Index.
The Harbor Business Cycle Indicator is a proprietary Indicator used by the Multi-Asset Solutions Team to measure growth momentum by country/region. The Indicator utilizes a set of leading United States economic indicators that are standardized and then aggregated into a singular composite score. A higher (lower) score implies a higher (lower) level of growth.
The U.S. Manufacturing Index is a subcomponent of the Harbor Business Cycle Indicator. The team produces a Business Cycle Regime measurement using the business cycle indicator, liquidity cycle indicator, fundamental recession probability model, and gauges of market internals. Business Cycle Indicator and Regime Sources: Bloomberg, Factset. The Business Cycle Indicator and Rate of Change Models assume that the historical relationship between the selected leading indicators and future economic growth remains stable. The growth and liquidity composites utilize a set of indicators that are standardized and then aggregated into a singular composite score. A higher (lower) score implies a higher (lower) level of growth and liquidity. The growth composite uses leading and concurrent economic signals to measure growth momentum. The liquidity composite measures prevailing conditions that we believe drive the Central Bank’s reaction function. A limiting factor for our modeling approach is if these relationships change, our models may be less accurate in measuring growth momentum.
The Harbor Liquidity Cycle Indicator is a proprietary Indicator used by the Multi-Asset Solutions Team to measure the prevailing conditions that we believe drive the Central Bank’s reaction function. The Indicator utilizes a set of indicators that are standardized and then aggregated into a singular composite score. A higher (lower) score implies a higher (lower) level of liquidity. The input variables measure growth momentum, inflation, normalized equity market valuations, and levels of leverage across the private sector and consumer. Liquidity Cycle Indicator Sources:
Harbor MAST, Bloomberg, Institute of Supply Management, Federal Reserve, Bureau of Labor Statistics. The Liquidity Cycle Indicator assumes that the historical relationship between the selected indicators and future liquidity conditions remain stable. A limiting factor for our modeling approach is if these relationships change, our models may be less accurate in terms of measuring the conditions that drive liquidity.
The Harbor Lending Index is a proprietary Indicator used by the Multi-Asset Solutions Team to measure bank lending conditions. The indicator uses a set of surveys and lending data that are standardized and then aggregated into a singular composite score. A higher (lower) score implies a higher (lower) level of bank lending. Sources: Bloomberg, Federal Reserve. The Harbor Lending Index assumes that the historical relationship between the selected indicators and lending remain stable
The Trend Inflation Composite is a proprietary Indicator used by the Multi-Asset Solutions Team to measure the prevailing conditions that we believe drive realized inflation. The Indicator utilizes a set of indicators that are standardized and then aggregated into a singular composite score. A higher (lower) score implies a higher (lower) level of realized inflation. The input variables measure wages, commodity prices, labor demand, and inflation data inputs. Trend Inflation Composite Sources: Harbor MAST, Bloomberg, Institute of Supply Management, Federal Reserve, Mortgage Bankers Association, U.S. Department of Commerce, Bureau of Labor Statistics.
The Market Sentiment Indicator is a proprietary Indicator used by the Multi-Asset Solutions Team to measure the prevailing conditions that we believe explain market sentiment. The input variables are predominantly market price variables that reflect price momentum across various styles and sectors within equities, credit, fixed income and commodities markets. Market Sentiment Indicator Sources: Harbor MAST, Bloomberg. A limiting factor for our modeling approach is if these relationships change, our models may be less accurate in terms of measuring the conditions that drive market sentiment.
The Growth Composite utilizes a set of indicators that are standardized and then aggregated into a singular composite score and uses leading and concurrent economic signals to measure growth momentum. A limiting factor for our modeling approach is if these relationships change, our models may be less accurate in measuring growth momentum.
3516973


